Whitebox Strategy Engine » Trading Widget
Overview
The Trading Widget is an informational dashboard displaying various strategy-specific metrics. It is shown to the right of the most recent candle.
Sections
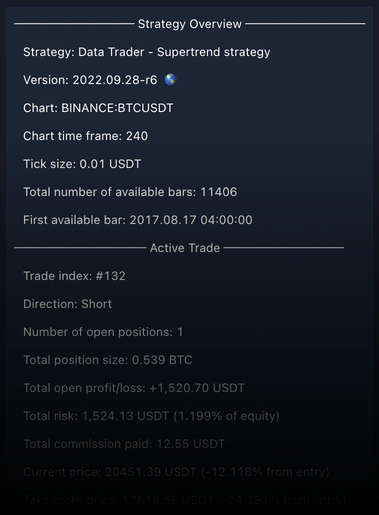
Strategy Overview
- Strategy: The name of the strategy being used
- Version: The version of the strategy
- Chart: The exchange and the market the strategy is running on
- Chart time frame: The timeframe of the chart
- Tick size: The unit of the smallest possible price change
- Total number of available bars: The number of historic bars loaded on the chart on which the strategy ran the backtest
Active Trade
- Trade index: To help reference each trade on the chart, each trade gets associated an auto-incrementing number, this is the trade index. The first trade will have an index of 1, the second will have an index of 2, and so on. A trade usually consists of two orders (aka positions): one to enter the trade and one to exit it. Sometimes however a trade can be made up of more than two orders, specifically when DCA is enabled. If DCA is enabled, there may be multiple entry and exit orders inside each trade. Even if there are more than two orders in a trade, the trade index will be maintained. In other words, if a trade is made up of 5 entry and 5 exit orders, the trade will have a single index associated to it.
- Direction: The direction of the trade (Long / Short).
- Number of open positions: Shows how many positions are open at the. This will usually say 1, however if DCA is enabled, there may be multiple positions open at the same time.
- Total position size: The sum of the position size of all open positions.
- Total open profit/loss: The combined profit/loss of all open positions.
- Total risk: The sum of the risk of all open positions. Should the stop loss be hit, this is how much money you would lose on the trade. If a stop loss is not used, the risk cannot be calculated.
- Total commission paid: The sum of commission paid for each entry order.
- Current price: The price the instrument was most recently traded at.
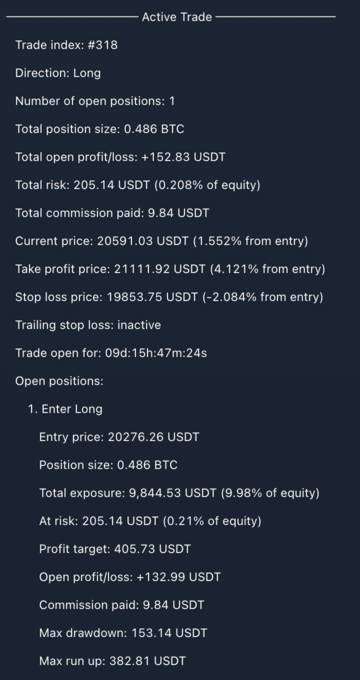
- Take profit price: The price level at which the take profit was placed at. This can change throuhout a trade if DCA is enabled.
- Stop loss price: The price level at which the stop loss was placed at. This can change throughout a trade if a dynamic stop loss is used.
- Trailing stop loss: Shows whether the dynamic stop loss system has been activated.
- Trade open for: How long the trade has been opened for.
- Open positions: List of currently active positions (entries that have not been closed yet)
- The first row will show the description of the entry. This will be either Enter Long (for long entries) or Enter Short (for short entries). If DCA is used there will be more than one entry, please see below.
- Entry price: The price at which the entry was made.
- Position size: The size of the position that was used for the entry.
- Total exposure: The amount of money that was used to open the position. In other words, this is how much money is locked into the trade.
- At risk: Should the stop loss be hit, this is the amount of money that would be lost.
- Profit target: Should the take profit be hit, this is the amount of money that would be gained.
- Open profit/loss: The profit/loss of the position. A positive number shows a profit, a negative number shows a loss.
- Commission paid: The amount of commission that was paid to open the position.
- Max drawdown: The amount of money you would have lost should you closed the position when it was at maximum loss.
- Max run up: The amount of money you would have gained should you closed the position when it was at maximum profit.
Active Trade with DCA enabled
If you have DCA enabled, the Trading Widget's Active Trade section will contain additional information about each DCA entries.
Let's have a look at the following example trade and discuss some of the differences to the previous non DCA trade we looked at above.
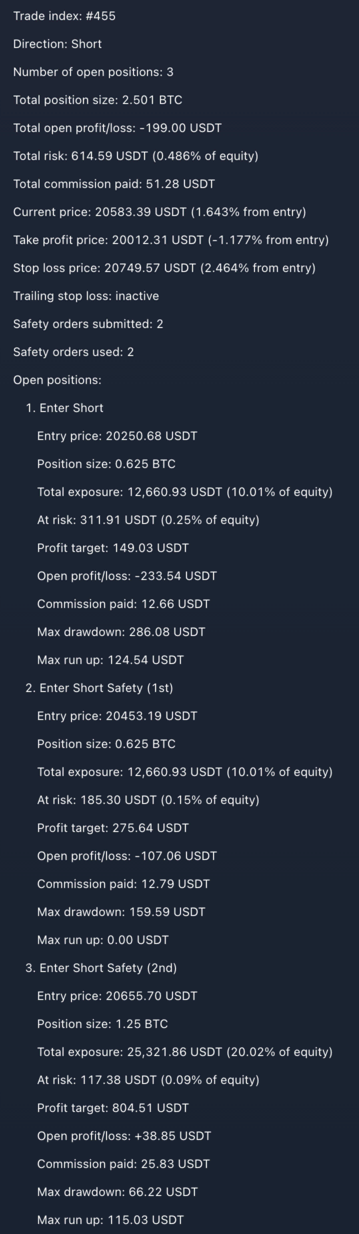
- Number of open positions: 3 - This tells us that there are 3 open positions at the moment (the "main" entry order that was used to enter into the trade, and 2 additional DCA entries)
- Total position size: The size of the position (entry order's position size + two DCA entries position size)
- Total open profit/loss: The combined profit/loss of each open position (entry + two DCA entries)
- Total risk: How much money would be lost should the stop loss be hit and all 3 open positions closed.
- Total commission paid: The amount of commission that was paid for the 3 entries.
- Take profit price: The price level at which the take profit was placed at. If this price is reached all 3 open positions will be closed.
- Stop loss price: The price level at which the stop loss was placed at. If this price is reached all 3 open positions will be closed.
- Safety orders submitted: The number of DCA orders that were placed (not necessarily filled yet).
- Safety orders used: The number of DCA orders that were filled.
The Open Positions will show each open position in detail. The top one will be always the first entry that was used to enter into the trade. This will say either Enter Long or Enter Short.
Besides that, there are two additional DCA entries, these will be listed underneath. Enter Short Safety (1st) was the first DCA order, and Enter Short Safety (2nd) was the second DCA order that was filled.
Long Entry
The Long Entry section lists the various criteria that has to be met for a long entry to be made. Each strategy will have strategy specific entry criteria listed here.
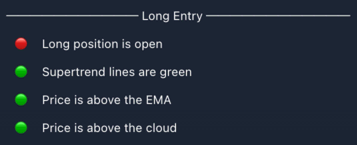
Each criteria will be on its own line. Criteria that has been met will have a 🟢 shown next to it. Criteria that hasn't been met will be with a 🔴.
- Long position is open: It is 🟢 if the strategy is in a long position, 🔴 otherwise (it is not really an entry criteria per se, it just shows whether the strategy is in a long position or not. This line is shown in every strategy.)
- Supertrend lines are green: 🟢 if all Supertrend lines are green, 🔴 otherwise (this entry criteria is strategy specific and it is only shown in the Supertrend strategy.)
- Price is above the EMA: 🟢 if price is trading above the specified EMA, 🔴 otherwise (this entry criteria is strategy specific and it is only shown in strategies that use an EMA trend direction filter.)
- Price is above the cloud: 🟢 if price is trading above the Ichimoku Cloud, 🔴 otherwise (this entry criteria is strategy specific and it is only shown in the Supertrend strategy.)
Sometimes (like in the example above) even if when all entry criteria is met, a position is not opened. Why is that?
Most of the time it is because there is a position already open in the other direction. In our strategies only a single trade can be active at any given time. If you are already in a short position, a long position would only be opened after the short position is closed, and provided the entry criteria was still valid at the time the short position was closed. Please note that positions won't be opened on the same candle as a position was closed on. There has to be a candle in between a position closure and a new position open.
Short Entry
The Short Entry section lists the various criteria that has to be met for a long entry to be made. Each strategy will have strategy specific entry criteria listed here.
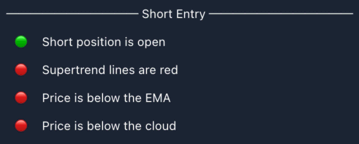
Each criteria will be on its own line. Criteria that has been met will have a 🟢 shown next to it. Criteria that hasn't been met will be with a 🔴.
- Short position is open: It is 🟢 if the strategy is in a short position, 🔴 otherwise (it is not really an entry criteria per se, it just shows whether the strategy is in a short position or not. This line is shown in every strategy.)
- Supertrend lines are red: 🟢 if all Supertrend lines are red, 🔴 otherwise (this entry criteria is strategy specific and it is only shown in the Supertrend strategy.)
- Price is below the EMA: 🟢 if price is trading below the specified EMA, 🔴 otherwise (this entry criteria is strategy specific and it is only shown in strategies that use an EMA trend direction filter.)
- Price is below the cloud: 🟢 if price is trading below the Ichimoku Cloud, 🔴 otherwise (this entry criteria is strategy specific and it is only shown in the Supertrend strategy.)
Once an entry is made, some (or all) the entry criteria may turn red (as it is in the screenshot above). It simply means that the entry criteria is no longer met, but it won't result in the closure of the currently open position.
Backtest Stats
The Backtest Stats section displays the backtesting performance of the strategy.
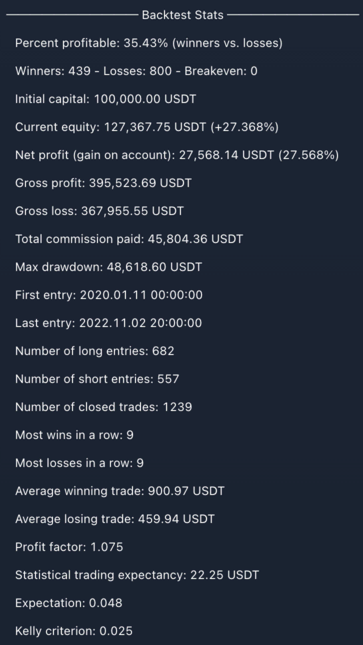
Most of the information that is displayed in this section is also available under the Strategy Tester tab in Performancy Summary. While the Strategy Tester tab is outside of the control of the strategy script, what is displayed in the Trading Widget is completely up to the script.
To learn more about the data displayed in the Strategy Tester tab please see https://www.tradingview.com/support/solutions/43000561856-how-are-strategy-tester-report-values-calculated-and-what-do-they-mean/.
- Percent profitable: The % of winning trades. Calculated by dividing the number of winning trades by the number of closed trades.
- Winners: The total number of winning trades.
- Losses: The total number of losing trades.
- Breakeven: The total number of breakeven trades.
- Initial capital: The capital the strategy begin trading with. Can be configured under
Properties/Initial capital. - Current equity: The current equity is the sum of the initial capital, net profit, and unrealised profit/loss.
- Net profit: The overall profit or loss achieved by the strategy.
- Gross profit: The total profit for all profitable trades generated by a strategy.
- Gross loss: The total losses for all losing trades generated by a strategy.
- Total commission paid: The sum of the commission paid on all trades. Note that a trade consist of (at least) two orders. One order to enter into the trade, and one order to close it. Commission is paid on each order.
- Max drawdown: Displays the greatest loss drawdown, i.e. the greatest possible loss the strategy had during its run compared to its highest profits.
- First entry: The date & time of the first entry.
- Last entry: The date & time of the last entry.
- Number of long entries: The total number of long entries.
- Number of short entries: The total number of short entries.
- Number of closed trades: The total number of trades that have been closed.
- Most wins in a row: The highest number of consecutive winning trades.
- Most losses in a row: The highest number of consecutive losing trades.
- Average winning trade: The gross profit divided by the number of winning trades.
- Average losing trade: The gross loss divided by the number of losing trades.
- Profit factor: The amount of money the strategy made for every unit of money it lost. Calculated by dividing the gross profits by the gross loss.
- Trading expectancy: The expected profit on average, for each trade made. It is calculated via
(win ratio x average win) – (loss ratio x average loss). For more info please see https://www.youtube.com/watch?v=0sdzGJirSWc - Expectation: Reflects how robust a trading plan is by measuring how sensitive it is to change in average loss. It is calculated via
trading expectancy / (average loss). For more info please see https://www.youtube.com/watch?v=0sdzGJirSWc - Kelly criterion: A formula that determines the optimal theoretical size for a bet. For more info please see https://www.investopedia.com/terms/k/kellycriterion.asp
As we have seen in the Active Trade section above, when DCA is enabled, things get slightly more complicated. This is also true for the information displayed in the Backtest Stats section.
Backtest Stats with DCA enabled
Let's see what happens to the various metrics under Backtest Stats when DCA is enabled.
To keep things simple, we restricted the strategy to a single long trade:
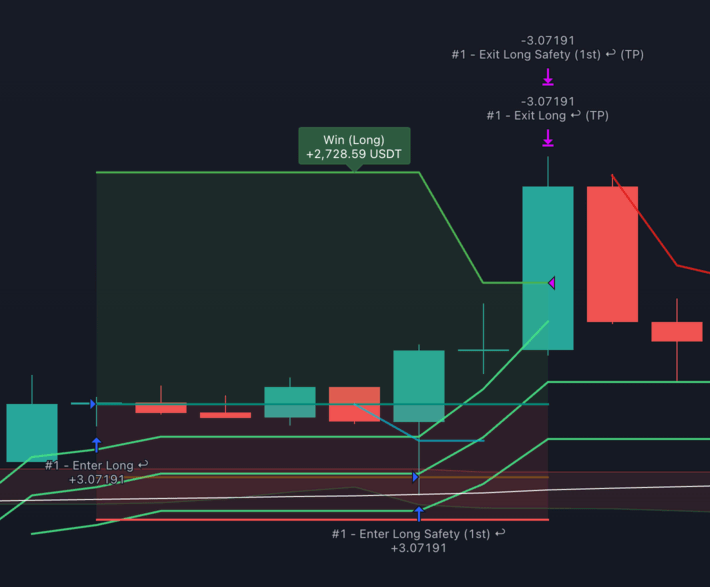
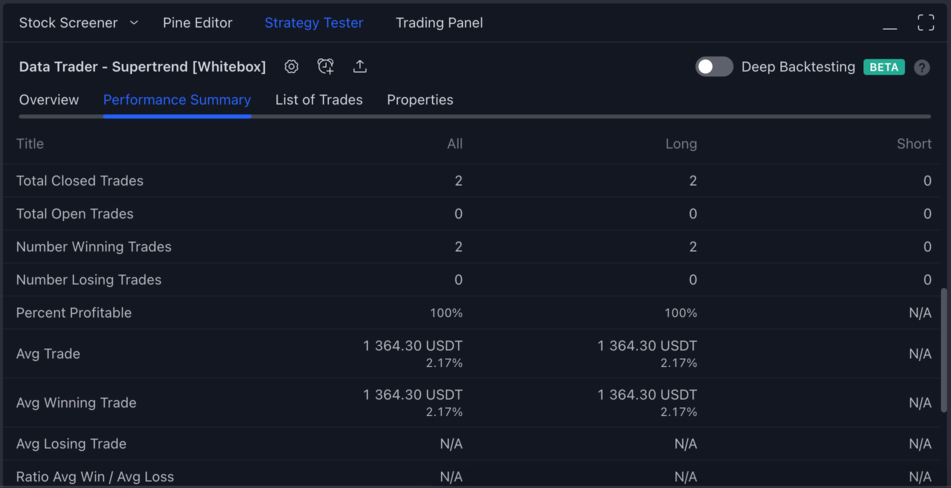
This is what the Backtest Stats section is showing:
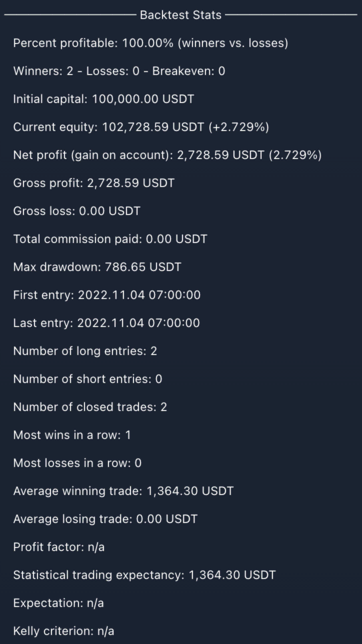
This is where things get a bit confusing.
Winners: 2, Number of long entries: 2 - Even though we've only had a single long trade, the statistics show that there were 2 winners and 2 long trades...
And not only that, but the Strategy Tester also thinks that there were 2 long trades:
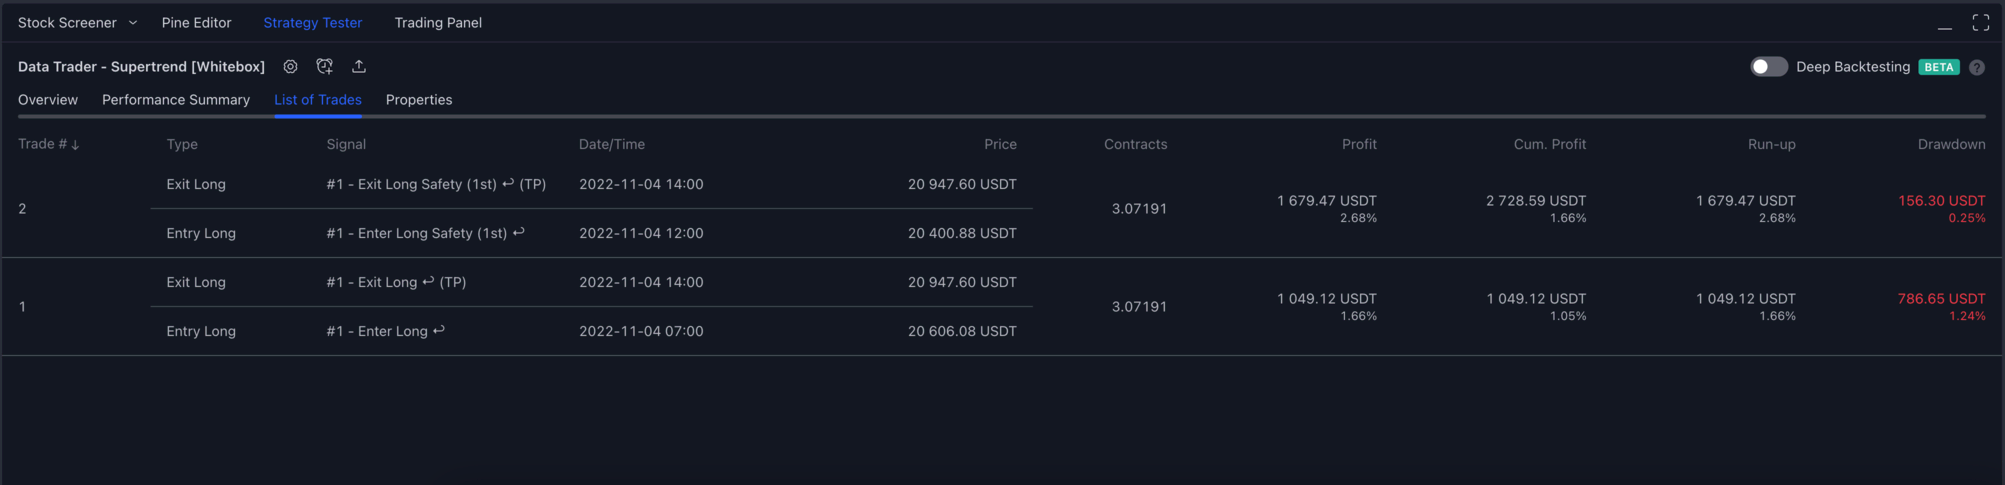
So what's going on? You see, TradingView's broker emulator has no concept of DCA trades. It doesn't know that the DCA order is a sort of "inner order" of the "main" long entry. To the broker emulator whenever a buy order is filled, it considers that being a new long entry.
In our example we have our first long entry at 2022-11-04 07:00 with Trade #: 1 and Signal: #1 - Enter Long.
The second long entry (the DCA buy order) happens 5 hours later at 2022-11-04 12:00. This has a Trade # of 2 and a Signal of #1 - Enter Long Safety (1st).
Finally, ~2 hours later at 2022-11-04 14:00 the TP was hit, which ended up closing both positions (the 1st entry, and the DCA entry).
Notice how each trade got assigned a unique Trade # (1 and 2), yet both the Enter Long and the Enter Long Safety (1st) shared the same index in their Signal (1). The number in the signal is how you can map a series of trades into a single trade. Each trade that has the same number associated in the Signal column are related. The first trade in the list is going to be main entry, and each subsequent trade will be DCA trades.
Aggregate Results to the rescue
As we have seen in the example above, when DCA is enabled, both the Strategy Tester and the Backtest Stats section of the Trading Widget will count each pair of entry / exit orders individually.
This makes reading the results a bit confusing, as you cannot really see how many trades were performed not counting DCA trades.
Because of this, we have added an option to the Trading Widget settings to allow aggregating trading results.
If you open the settings and scroll down to the Trading Widget section, you will find a checkbox that says: Display Aggregate Results. If you enable this checkbox, the strategy will display the aggregated results beside the non-aggregated one:
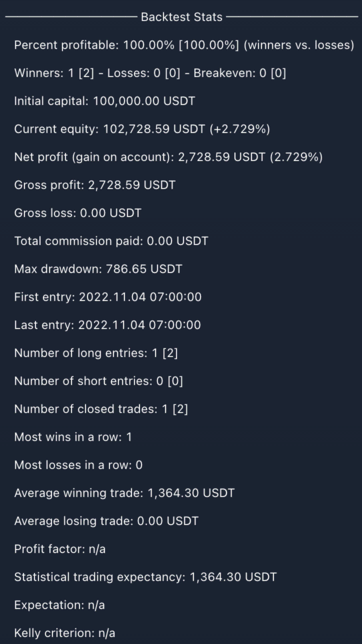
- Winners: 1 [2] - 1 is the aggregated win count (i.e. there was a single "main" entry), whereas 2 is the non-aggregated count showing that besides the main entry there were other (DCA) entries.
- Number of long entries: 1 [2] - 1 is the aggregated long entry count, 2 is the non-aggregated.
- Number of closed trades: 1 [2] - 1 is the aggregated closed trades count, 2 is the non-aggregated.
Please note that the strategy has no control over what is shown under the Strategy Tester tab, so the aggregate results are only shown in the Trading Widget.
Settings
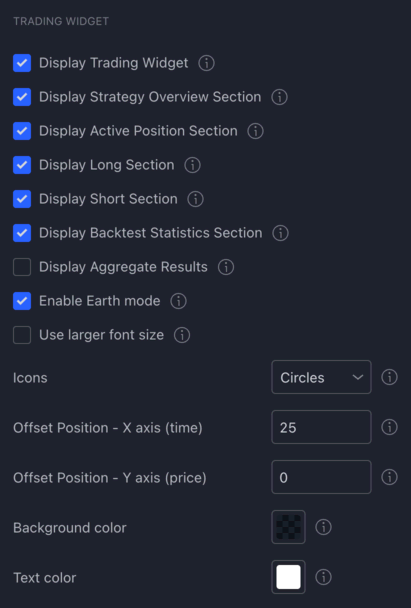
- Display Trading Widget: If enabled, the Trading Widget will be displayed on the chart.
- Display Strategy Overview Section: If enabled, the 'Strategy Overview' section will be shown in the Trading Widget.
- Display Active Position Section: If enabled, the 'Active Position' section will be shown in the Trading Widget.
- Display Long Section: If enabled, the 'Long' section will be shown in the Trading Widget.
- Display Short Section: If enabled, the 'Short' section will be shown in the Trading Widget.
- Display Backtest Statistics Section: If enabled, the 'Backtest Stats' section will be shown in the Trading Widget.
- Display Aggregate Results: If enabled, the strategy will display the aggregated backtesting metrics besides the non-aggregated results (see above).
- Enable Earth Mode: This is just a gimmick feature that will display a spinning Earth emoji in the Trading Widget.
- Use larger font size: If enabled, the Trading Widget will use a larger font size.
- Icons: Select the type of icons to use in the Long and Short sections.
- Offset Position - X axis (time): When set to a number greater than 0, the Trading Widget's position will be offset to the right on the X axis.
- Offset Position - Y axis (price): When set to a number greater than 0, the Trading Widget's position will be offset lower on the Y axis.
- Background color: Set the background colour of the Trading Widget.
- Text color: Set the text color of the Trading Widget.