Whitebox Strategy Engine » Appearance
Overview
The options under the Appearance settings allow you to change some of the visuals on the chart.
Settings
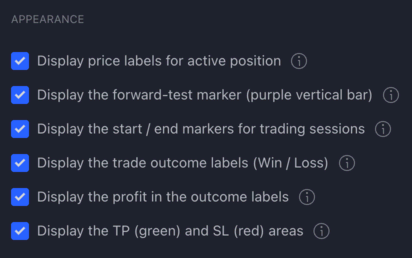
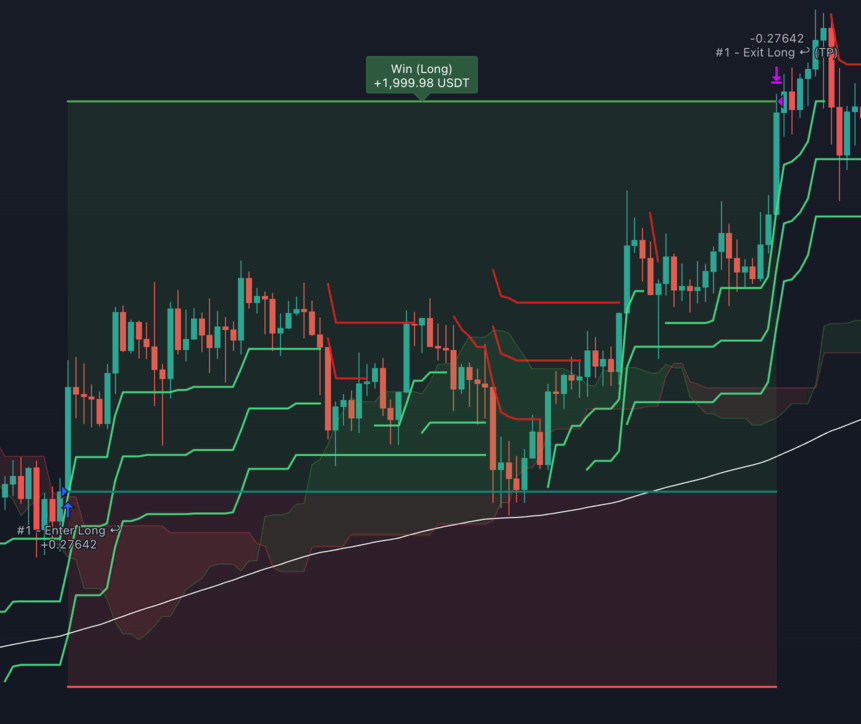
Display price labels for active position
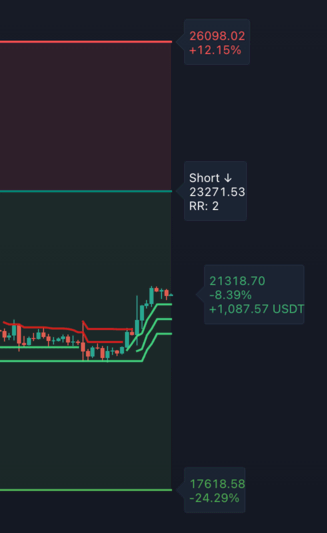
If you enable price labels, when the strategy is in a position, it will display a label for the following prices:
- Entry price (white) - This shows the direction of the trade, the entry price and the position's risk/reward ratio.
- Take profit (green) - This points to the price level at which the take profit was placed at. The label shows the price and its distance from the entry price expressed as a %.
- Stop loss (red) - This points to the price level at which the stop loss was placed at. The label shows the price and its distance from the entry price expressed as a %.
- Current price (green or red) - This simply shows where the current price is at. If green, the position is in profit, if red the position is in loss. The label shows the current price, the distance from the entry price expressed as a %, and the unrealised profit/loss.
If you ever get confused about which label is what, just hover your mouse over the labels, and their name will be shown in a tooltip.
Display the forward-test marker (purple vertical bar)
If enabled, the strategy will print a purple vertical bar on the candle on which it began forward-testing. All candles that are before the purple bar are historic. The strategy was running a backtest on these candles. All candles that are formed after the purple bar are realtime candles, and the strategy is performing a forward-test on these.
One of the greatest challenges of developing strategy scripts is to make sure the strategy behaves the same when it is executing on historic candles (i.e. it is backtesting) vs. when it is executing on realtime candles (i.e. it is forward-testing).

Plese keep this setting enabled, as it will help us later when it comes to debugging issues with the strategy.
Display the start / end markers for trading sessions
If enabled, the strategy will display the start (green) and end (red) bars that mark the beginning and the end of trading session (as set in Restrict Entries To Days And Time Range).
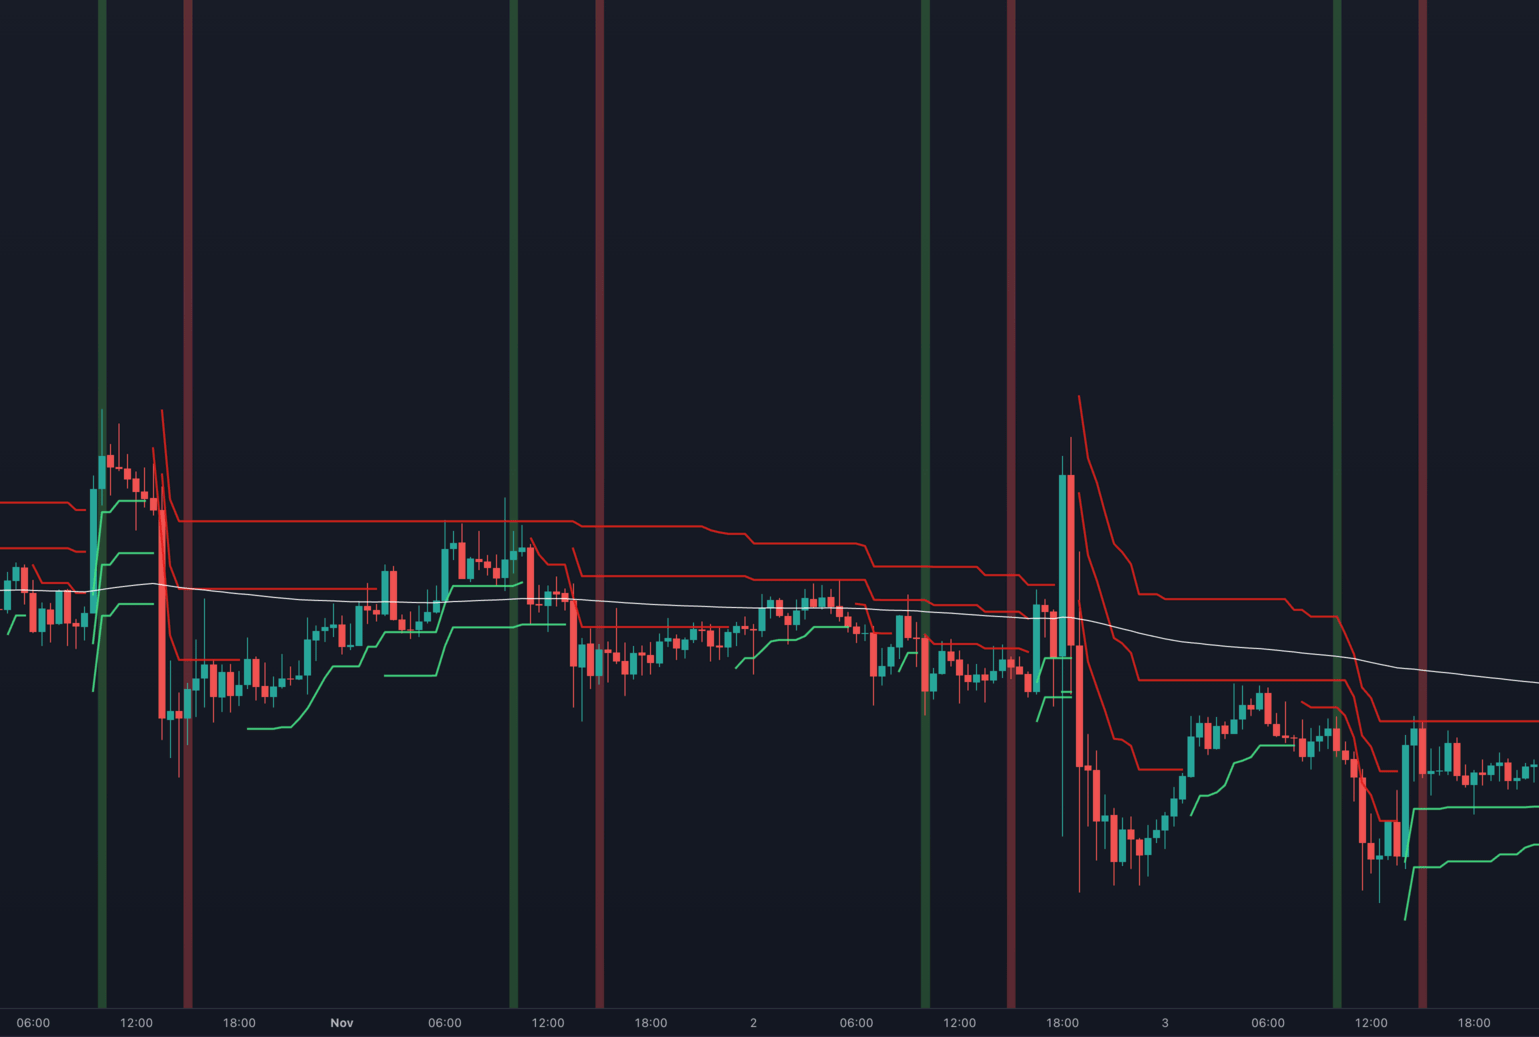
It is a good idea to enable these markers to help you visualise the window in which trading takes place.
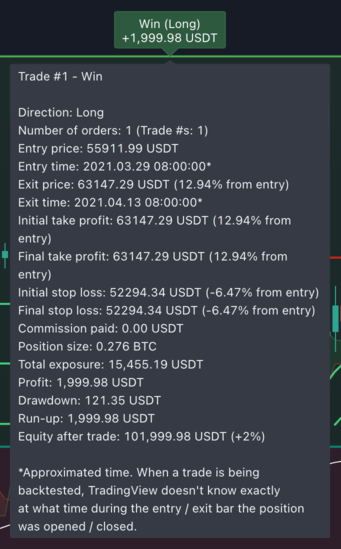
Display the trade outcome labels (Win/Loss)
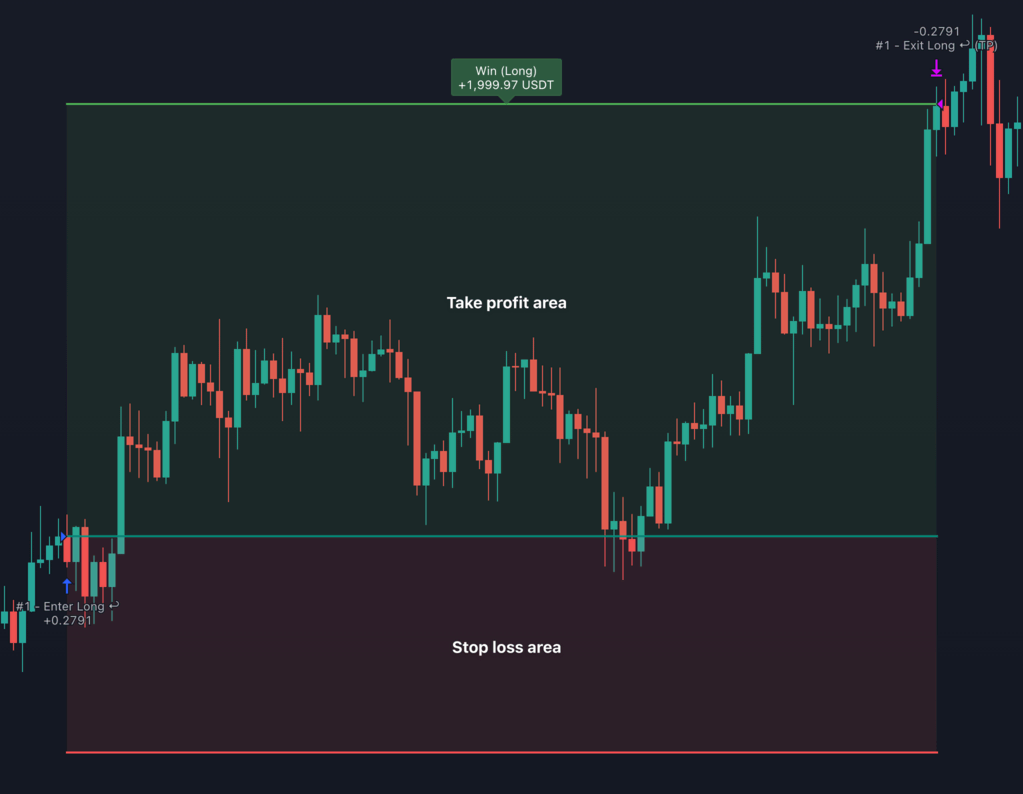
If enabled, the strategy will display the green and red "Win" / "Loss" labels above / below each trade:
For more details about each closed trade hover your mouse over the outcome label:
Display the profit in the outcome labels
If enabled, the strategy will show the realised profit/loss in the outcome labels.
Display the TP (green) and SL (red) areas
If enabled, the strategy will draw a green area between the entry price and the take profit, and a red area between the entry price and the stop loss.