Whitebox Originals » Darvas Box strategy
Overview
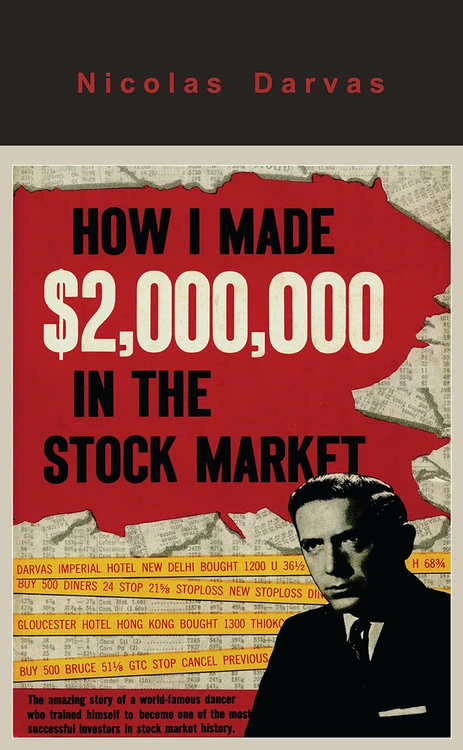
This TradingView strategy script implements the Darvas Box strategy Nicolas Darvas described in his seminal book How I Made $2,000,000 in the Stock Market.
The Darvas Box strategy script is so unique (compared to our other scripts) that we had to create a custom version of our Whitebox Strategy Engine just for this strategy. Due to this reason, you don't necessarily have to understand how the Whitebox Strategy Engine that powers our other strategies works. Everything you need to know about using this strategy is documented on this page.
💡 Before using this strategy, we highly recommend reading Darvas's book. Not only because it will give you a good understanding of the strategy but because you will also learn about the difficulties he had to go through before he was able to make a fortune on the stock market.
🔐 To get access to the script, you need to have an active subscription set up on our site at https://whitebox.so.
Important Reminder & Disclaimer
While the Darvas Box strategy, as detailed in Nicolas Darvas's book "How I Made $2,000,000 in the Stock Market," has been historically successful for Darvas himself, it's crucial to understand that past performance is not indicative of future results. Applying this strategy to any chart does not guarantee similar outcomes or any specific financial results.
This script is designed to help users backtest the Darvas Box strategy and be alerted to new Darvas Box formations. It has not been optimized for any particular stock or market condition. It should be used as a tool to assist in your trading decisions, not as a definitive answer.
Trading involves risks, and it's essential to conduct your own research, understand the strategy thoroughly, and consider your financial situation, needs, and level of experience before making any trading decisions. Always remember that all investment strategies and market analysis carry the risk of loss. Use this tool responsibly and in conjunction with other research and analysis methods.
About Nicolas Darvas
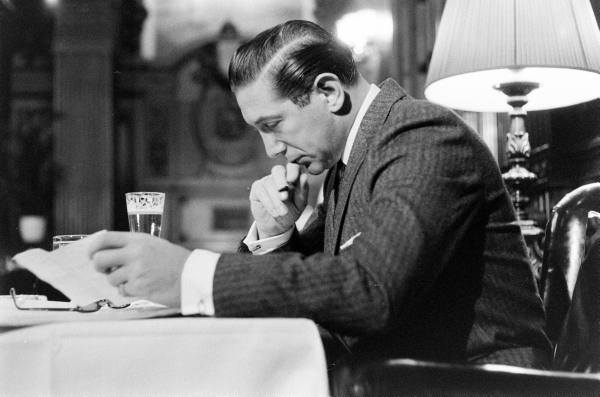
Nicolas Darvas (1920–1977) was a dancer, self-taught investor, and author. He is best known for his book, "How I Made $2,000,000 in the Stock Market."
Nicolas Darvas was a dancer by profession, but he is best known for his adventures in the stock market. Born in Hungary in 1920, Darvas fled the enemy and eventually settled in the United States. While touring the world as a professional dancer, he began dabbling in the stock market and developed his unique approach to trading, which he later detailed in his book "How I Made $2,000,000 in the Stock Market."
Despite having no formal financial education, Darvas's keen observation and disciplined approach turned his initial investment of $36,000 into $2 million in a short span of 18 months during the late 1950s. His success story became legendary, and his trading method, known as the Darvas Box strategy, is still studied and applied by traders worldwide.
Darvas Box strategy explained
The essence of the Darvas Box strategy lies in identifying "boxes" or trading ranges in which a stock moves for a certain period. Darvas believed that a stock's price movement within these boxes represented periods of consolidation before a potential breakout.
Box Formation
A box is formed when the stock price moves within a defined range, marked by a high and a low. The high serves as the box's top, and the low serves as the box's bottom.
Breakout
When the stock price breaks above the top of the box on significant volume, it signals a potential upward move, and Darvas would buy the stock. Conversely, if the stock price broke below the box, it indicated a potential downward move, and he would sell the stock.
Stop-Loss Discipline
One of the key aspects of Darvas's strategy was his strict adherence to stop-loss orders. He always set a stop-loss just below the box's top to limit potential losses. This approach ensured that he cut his losses early and let his profits run.
Fundamental Analysis
While the Darvas Box strategy is primarily technical, Darvas also incorporates fundamental analysis. He preferred stocks from industries with future growth potential and looked for companies with strong earnings.
Volume Confirmation
Darvas paid close attention to trading volume. A breakout accompanied by high volume was seen as a stronger signal compared to a breakout on low volume.
Continuous Monitoring
Darvas continuously monitored his stocks and adjusted his boxes as the stock price moved. If a stock moved into a new box and stayed there, he would adjust his stop-loss accordingly.
In essence, the Darvas Box strategy is a combination of trend-following and momentum trading backed by sound risk management principles. It's a testament to the strategy's effectiveness that it remains popular among traders even today, decades after Darvas first introduced it.
Applicable markets
Darvas only used his box method for trading stocks, so we will also focus on using the script on stocks.
However, nothing should stop you from applying the strategy to other markets, such as crypto, forex, commodities, etc.
Darvas' journey in the stock market began with a speculative investment in a Canadian mining company, and from there, he developed his Box Theory and applied it to the U.S. stock market. His methods and strategies were tailored to the characteristics and behaviours of stocks, and that's where he found his success.
Applicable stocks
In his book, Darvas described himself as a "techno-fundamentalist". He used both technical and fundamental analysis to choose the stocks he considered worthwhile buying.
He would look for stocks in industries where he expected the companies to do well over the next 20 years.
Then, he filtered the stocks by looking at their price action and volume. If a stock were trading near its all-time high, especially on unusually large volume, he would pay close attention to it. Once he selected a stock based on these criteria, he waited for his boxes to begin forming.
Once a box formed, he would place a buy-stop order just above the top of the box and a stop-loss order below the top. He would automatically enter a long position if the price broke above the box. If the price fell below the box's top, his automatic stop-loss order immediately took him out of the trade, resulting in a slight loss. A key aspect of his strategy was to cut his losses small and let his winners run. Even if he suffered several losses in a row, given how close his stop-loss orders were to his entry price, those losses were relatively negligible. However, once he bet on the right stock at the right time, without being stopped out, he recovered from all his losses and won big money.
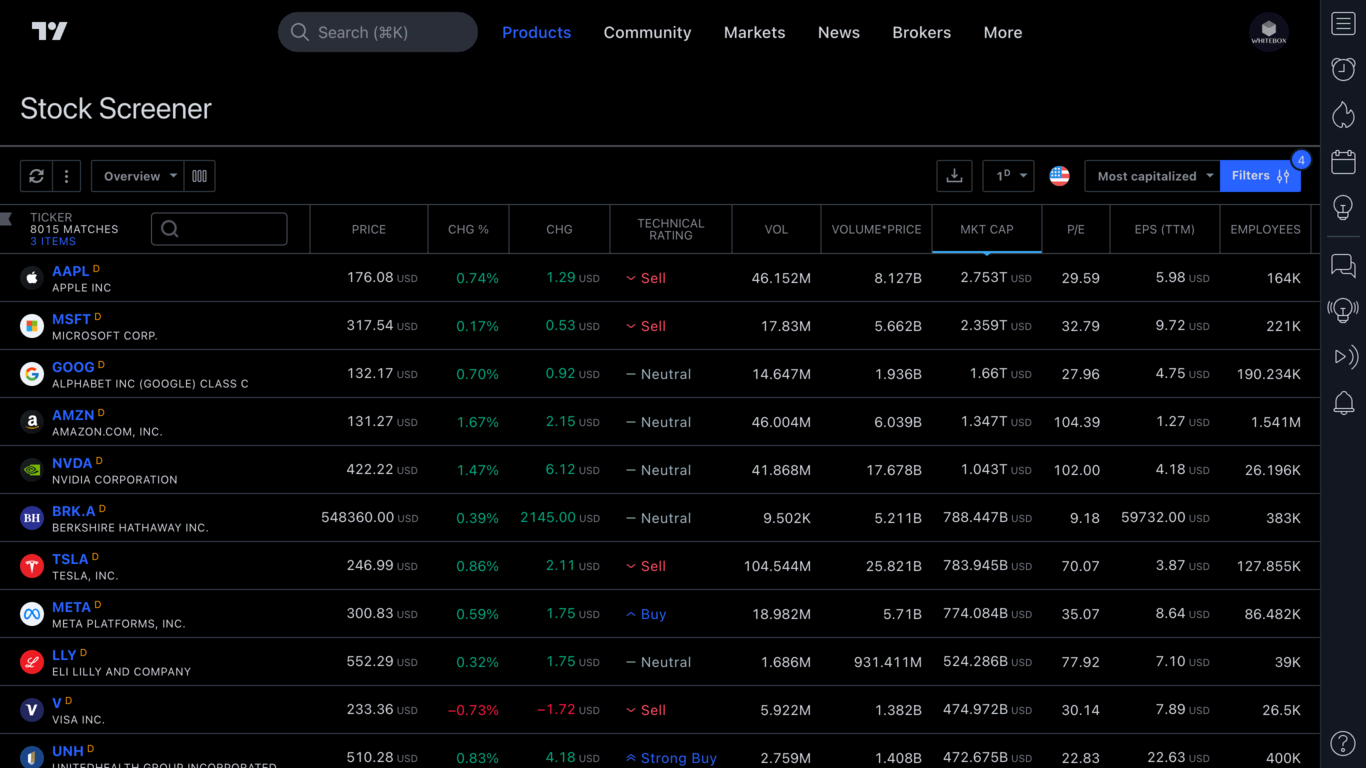
Using TradingView's Stock Screener to find "Darvas stocks"
In the 1950s, Darvas used Barron's weekly newspaper to search for stocks to which he could apply his strategy. Luckily, today, we no longer have to wait days for a publishing company to draw charts with fresh price information. Instead, we can choose from a myriad of stock screener services to obtain the same information.
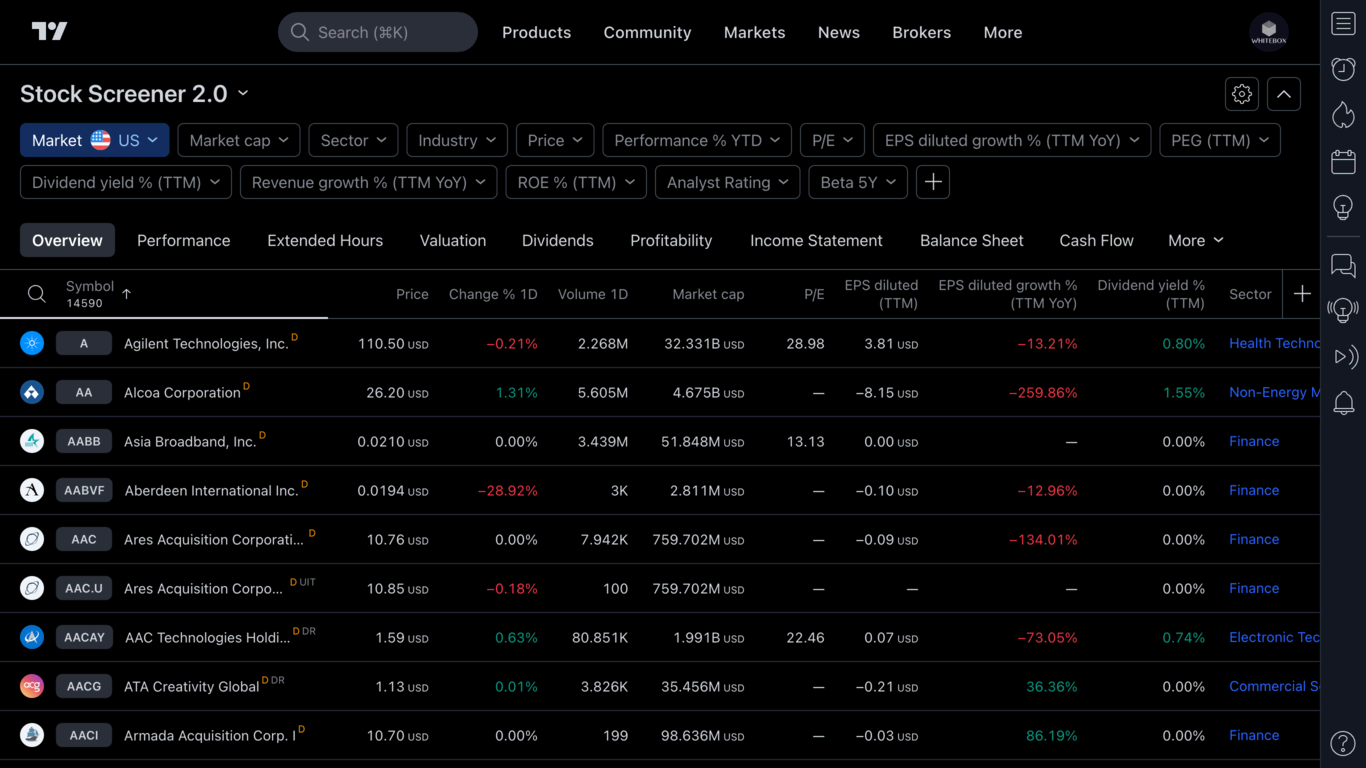
Given that we are using the TradingView platform, the most natural choice is to use their Stock Screener to find Darvas stocks.
TradingView currently offers its Stock Screener utility in two editions:
- Stock Screener 1.0 (https://www.tradingview.com/screener/)
- Stock Screener 2.0 (https://www.tradingview.com/stock-screener/)
Both versions have pros and cons, which we will discuss in the sections below.
TLDR: Use version 2.0.
Stock Screener 1.0
First, let's see how to use version 1.0 to find Darvas stocks.
To open version 1.0 of the Stock Screener, click here: https://www.tradingview.com/screener/.
The first version of the Stock Screener has been an integral part of TradingView for quite some time, and it offers various filters to help narrow down the list of stocks.
Unfortunately, version 1.0 of the screener does not support the most important price filter relevant to our quest for Darvas stocks, namely:
"Show only stocks with a price 0-5% below the All-time/52-week High"
You may wonder: what is the point in using the screener if it doesn't know how to filter stocks on price?
While it is true that, by default, it doesn't know how to filter the stocks based on the price criteria, however, we can use external tools to help us achieve what we want. The screener allows you to export the list of stocks to a CSV file, which you can easily import into an Excel (or Google Sheets) spreadsheet. Once the data is in Excel, you can apply custom filters to show only those stocks that meet the price criteria.
We have created a "Darvas Stock Screener" Google Sheet that allows you to import a CSV file from TradingView and filter the results based on the price criteria mentioned above.
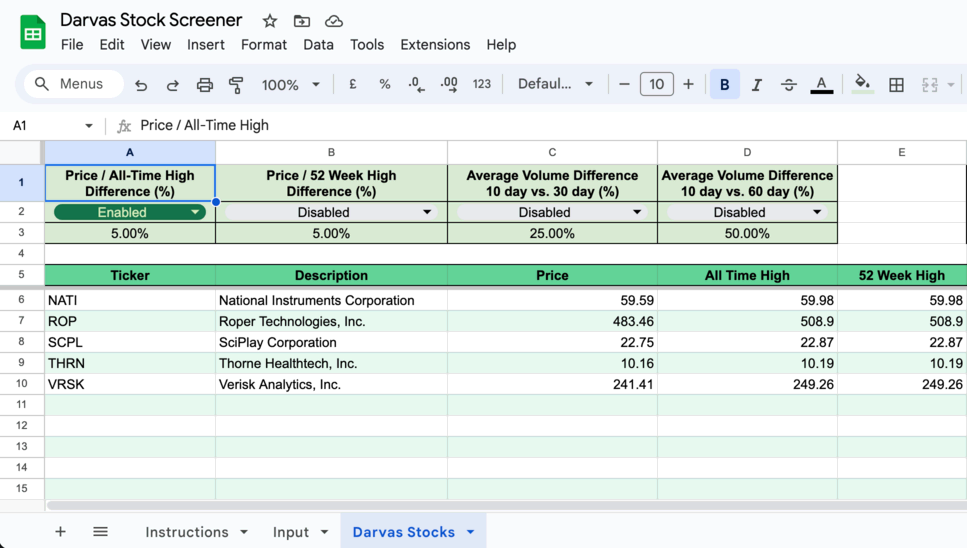
The Google Sheet can be accessed by clicking here.
For instructions on how to use it, please follow the steps provided on the Instructions tab.
Stock Screener 2.0
To open version 2.0 of the Stock Screener, click here: https://www.tradingview.com/stock-screener/.
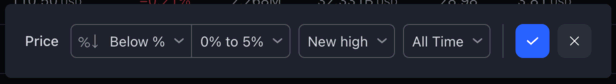
Version 2.0 is a recent addition to TradingView. While this newer version of the screener may look similar to version 1.0, it seems to be a complete rewrite of its predecessor. The way you configure the filters is completely different.
And not only that, but TradingView gives you much more freedom in creating more advanced filters. Most importantly, version 2.0 allows you to create the price filter we could not create in 1.0:
Furthermore, it also allows you to filter on average volume:
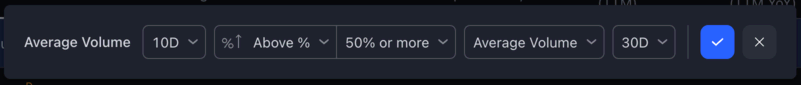
With version 2.0 supporting both filters relevant to searching for Darvas stocks (price & volume), is there any point in using 1.0?
No, not much. Other than the fact that 2.0 is still in beta, and it lacks basic functionality. For example, it doesn't allow you to save your filter/column configuration. Every time you refresh the page, you will need to set up everything from scratch.
If you don't mind this limitation, just use 2.0. You save yourself from having to export and import the CSV into the Google Sheet.
Strategy script deep dive
Once you have identified a stock on which you would like to backtest the strategy, open the stock's chart and apply the Darvas Box strategy script to it.
Next, let's look at the various building blocks of the strategy.
Trades and Trade Groups
As mentioned in the introduction, this strategy is fundamentally different from the other strategies we have implemented so far.
One key difference is that pyramiding is allowed. In other words, you can add more stocks to an open position.
Before we look at how pyramiding is implemented in the strategy, let's quickly recap Darvas's trading strategy:
- He identified stocks that had potential for growth based on technical and fundamental factors
- Once he chose a stock, he waited for boxes to form on it
- Once a box formed, he placed a buy-stop order just above the top of the box
- If the price broke down below the box, he cancelled his buy-stop order and waited for a price to establish a new box
- If the price broke up above the box, his pending buy-stop order was automatically executed, entering him into a trade
- He placed his stop-loss a few ticks below the entry price. If he was wrong in his analysis, he wanted to be stopped out early before enduring large losses
- If the price of the stock was increasing, he began looking for new boxes forming. If he identified a new box, he raised his stop-loss to the bottom of the new box. At the same time, he also placed a buy-stop order just above the top of the box
- If the price broke up above the box, he bought more shares (pyramiding)
- He continuously monitored the chart for new boxes manifesting. With every new box appearing, he would repeat steps 7-8
- He remained in the trade until his trailing stop-loss was hit
When we started working on the script, we wanted to model Darvas's methodology as accurately as possible.
Luckily, TradingView's broker emulator (the system that allows a trading script to place trades on the chart) has built-in support for pyramiding positions. It allows scripts to buy more of the traded asset while a position is open. However, TradingView does not have a concept of grouping "related" trades. To TradingView, every single additional purchase is an isolated trade.
We found this concept quite confusing. We wanted to express somehow on the chart that there was a connection between a series of trades.
For example, let's say we identify a Darvas Box on TSLA. The price breaks above the box at $100, and we buy 100 shares. Then, as the price continues to grow, we enter again at $110 with 200 shares. Then again, at $120 with 300 shares. Finally, we would sell all 600 shares at $125.
When analysing our three buys and sells on TSLA, would we treat each entry as completely isolated? Or would we think of the trades as forming one coherent group?
For us, it was more intuitive to treat trades that are all part of the same "session" as a group. Therefore, we decided to introduce the concept of "Trade Groups" in this script.
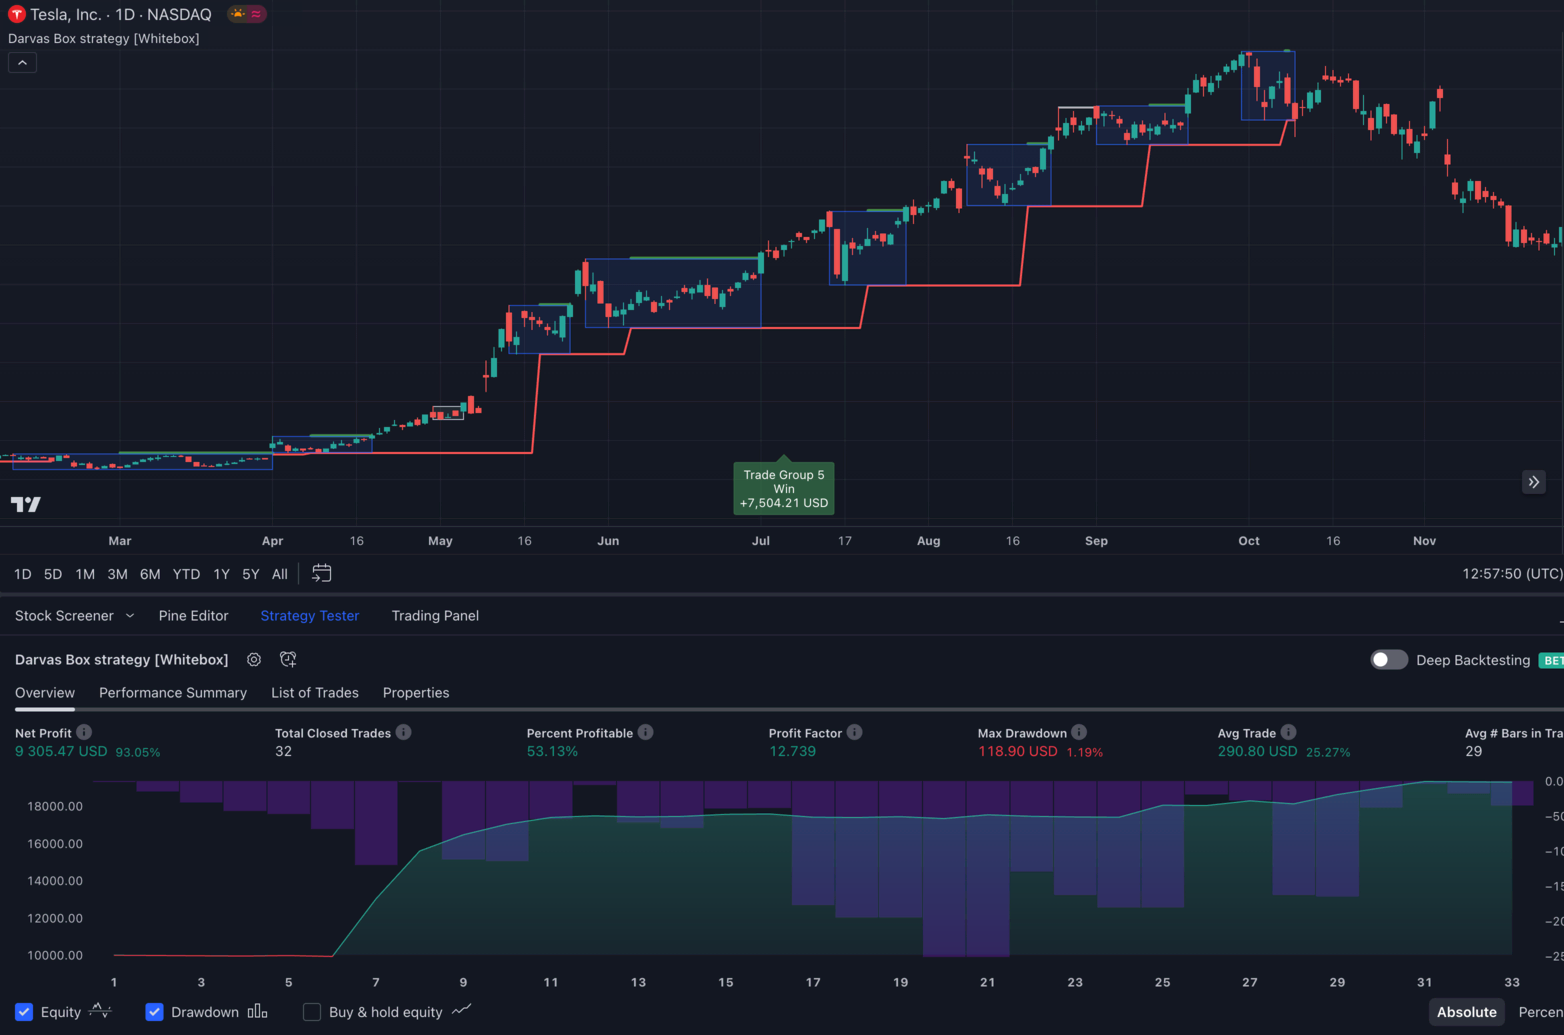
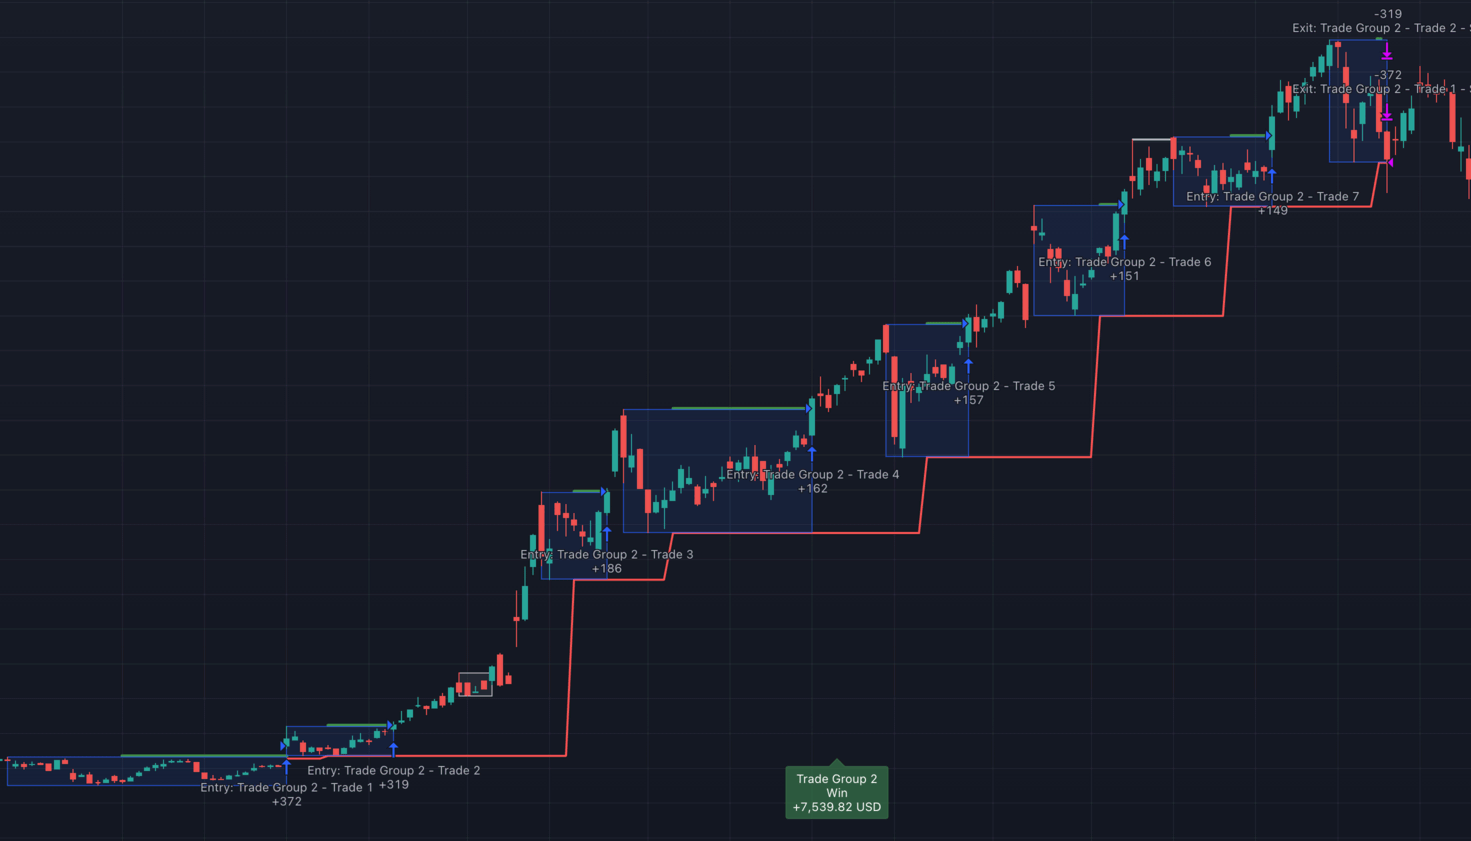
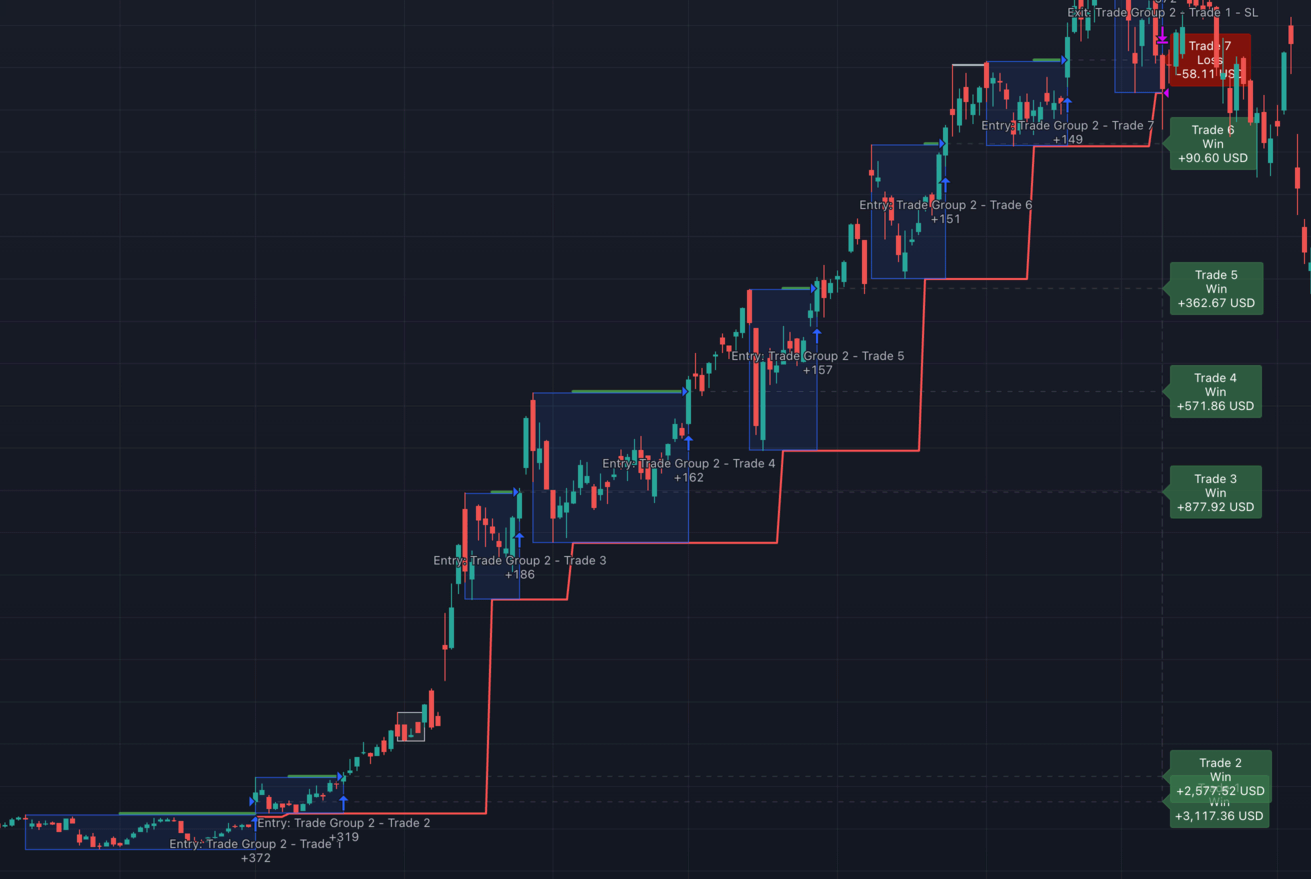
Let's look at the screenshot below that depicts a single "Trade Group" consisting of seven "Trades" on TSLA:
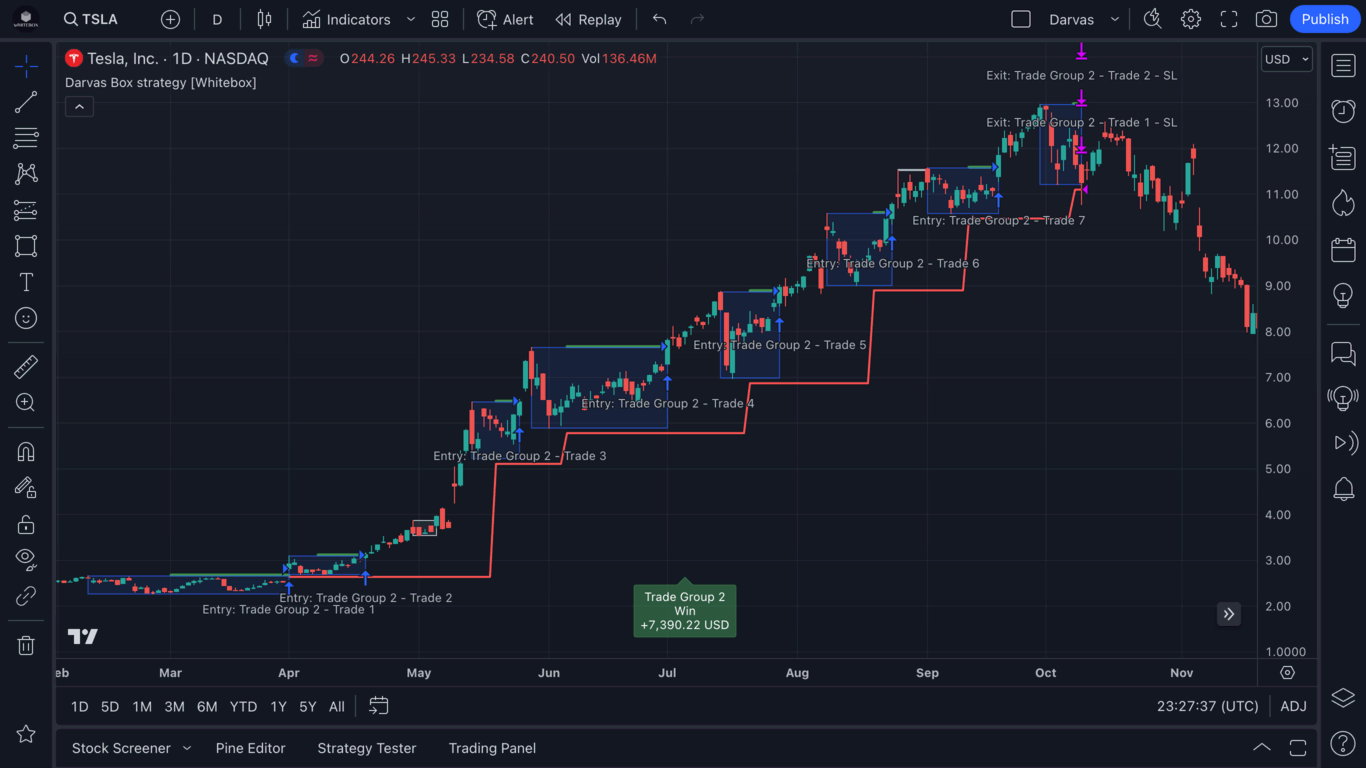
As you can see, a Darvas Box began to form sometime in February. Once it was a fully formed box (i.e. both the top and the bottom of the box were confirmed), the strategy automatically placed a buy-stop order one tick above the box (the green line above the blue Darvas Box is the pending buy-stop order). Eventually, the price was hit, and the strategy entered into a long position. Given that this was the first trade in this "session", the script decided to create a new Trade Group and treat this entry as being part of this new Trade Group. (The reason you see Trade Group 2 in the example above is because this was the second trading "session" the script executed on TSLA. If we were to scroll back in time on this chart, we would find Trade Group 1 and all Trades associated with it.)
Once the first entry was made (Trade 1), it was placed inside Trade Group 2. Then, the strategy continued to look for new Darvas Boxes forming. Between April and May, a new box was emerging. As soon as the box was confirmed, the stop loss was moved up to the bottom of the box. And at the same time, the strategy placed a buy-stop order one tick above the box. The entry price was hit, and the strategy opened a new Trade (Trade 2). Now, the Trade Group had two open Trades associated with it.
Between May and mid-October, there had been several Darvas Boxes forming. Each time a new box formed, the strategy continued to move the stop-loss higher and higher, and it also continued placing the buy-stop orders at the top of each box.
Eventually, after seven Trades in the Trade Group, the stop loss was hit in mid-October, and all seven Trades were closed. This has also resulted in the Trade Group being closed. (Note that there was an 8th box which started to form at the top of the rally, which caused the stop loss to move higher; however, the price never hit the top of this box and instead fell through it, resulting in all open trades being closed).
From this point on, the strategy had no positions open, and it began searching for new boxes again, ready to open new trades.
There are several benefits of having related trades grouped together:
-
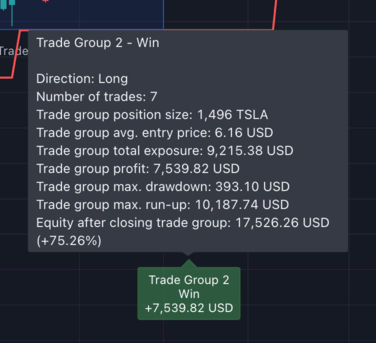
We can look at the statistics for both the Trade Group and the individual trades
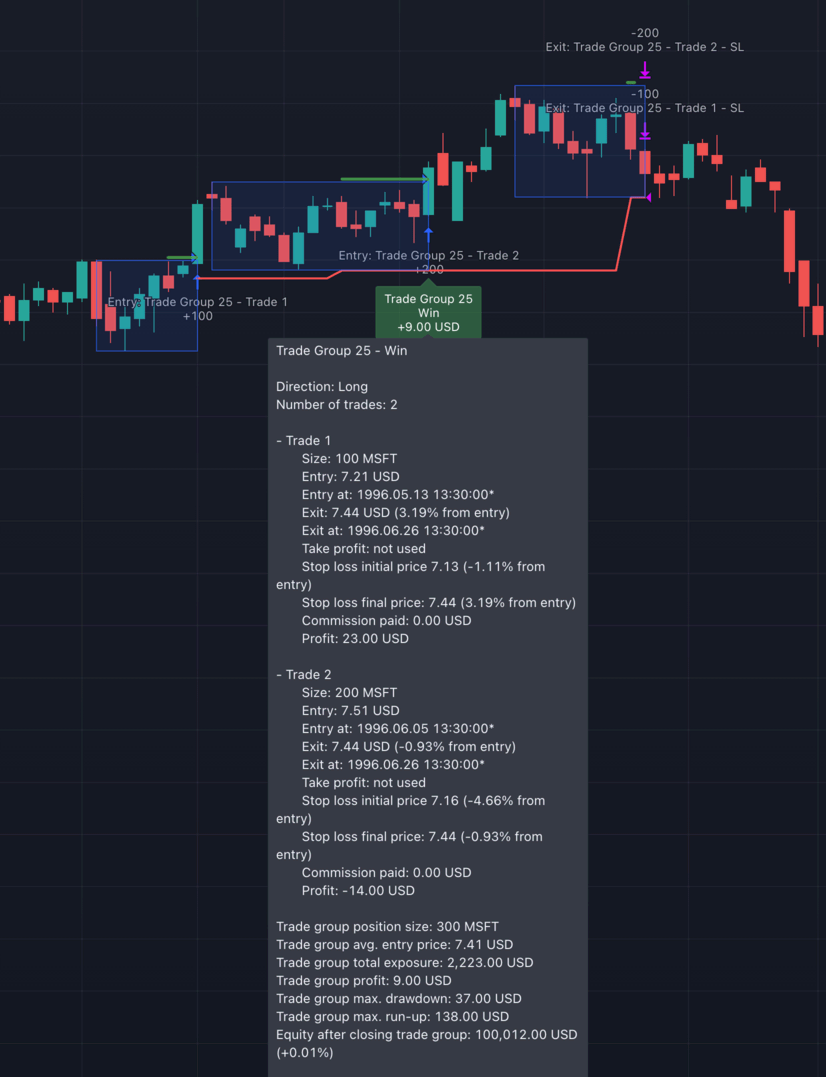
Take a look at this example Trade Group from
MSFT. In this group, there were two entries made. The first was a purchase of 100 shares at $7.21. The second entry bought 200 more shares at $7.51. Once the stop loss was hit at $7.44, all 300 shares were sold. We can see that Trade 1 made a profit on the 100 shares; however, Trade 2 was a loss. Did we make any money on these two trades?Well, the script makes it very easy for us to see. Underneath each closed Trade Group, it will print a label with the sum of the profit/loss of all trades in that group. Not only that, but if you hover your mouse over the label, it will also show you the statistics in a tooltip for each individual trade:
-
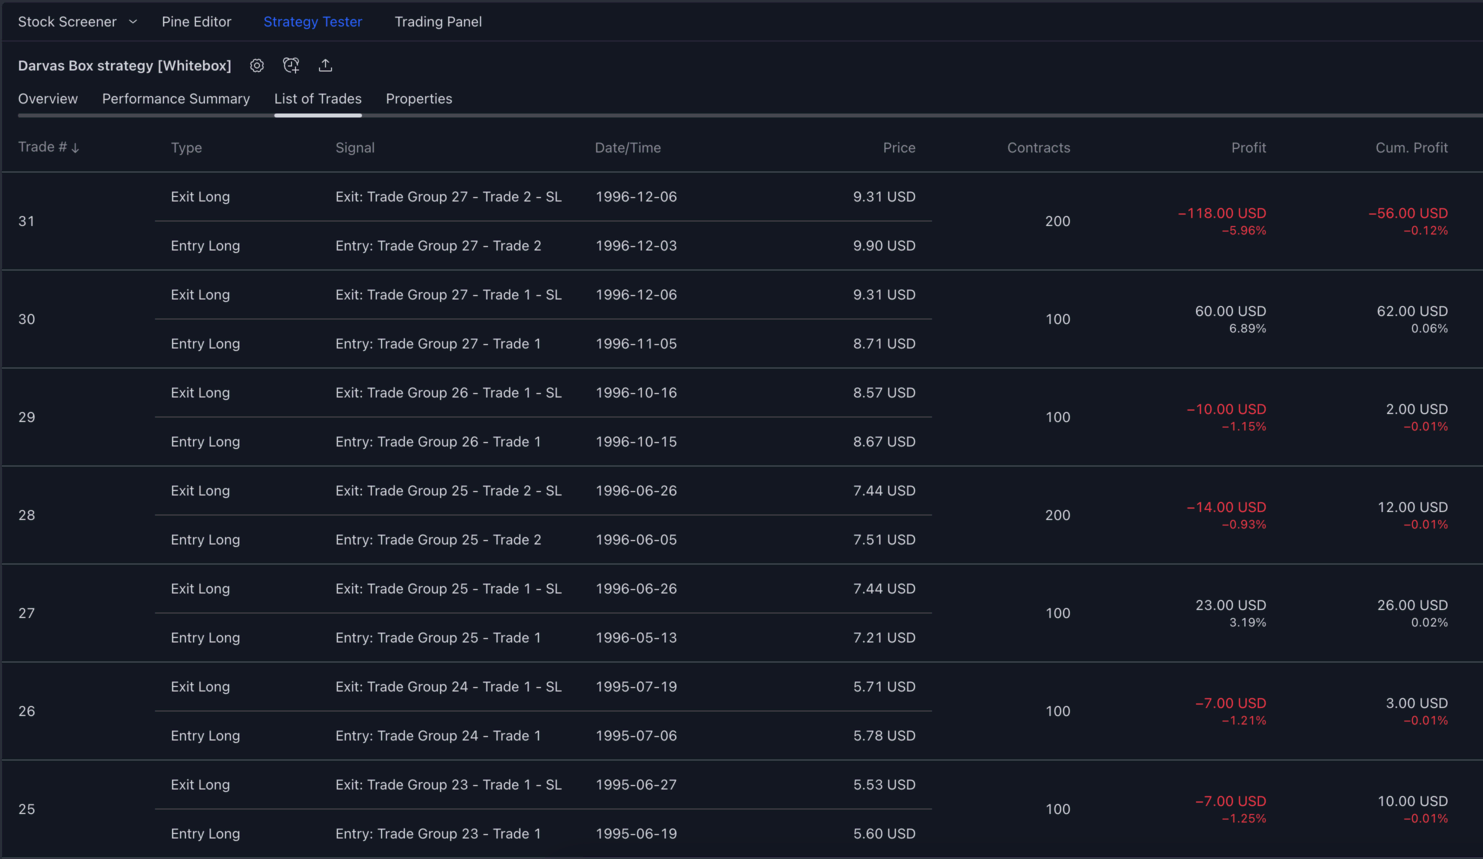
It is easier to make sense of the trades displayed on the "List of Trades" tab
With each individual trade assigned to a group, it is easy to see which trades were made in the same session.
For example, here we can see that both Trade Group 25 and Trade Group 27 consist of two trades (#27-28 and #30-31, respectively), whereas all the other groups are made up of just a single trade:
-
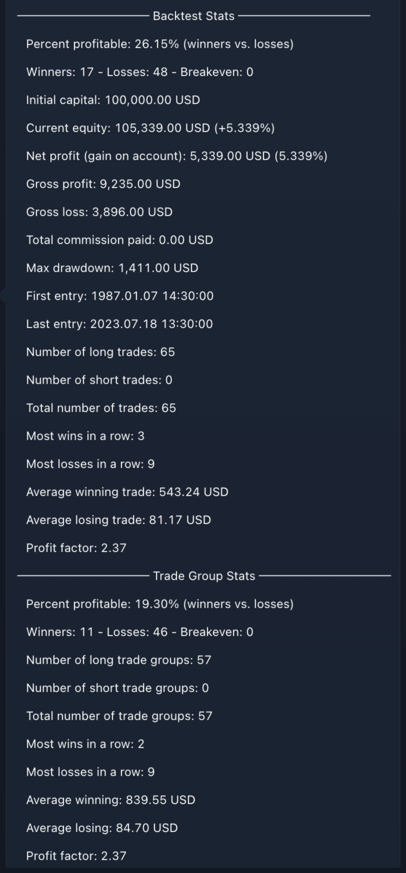
The Trading Widget can display both trade level and trade group level backtest statistics
In the example below, we can see that there were 65 trades made in total and that those trades were assigned to 57 different trade groups. The average win was $543.24 (at the individual trade level), whereas a trade group's average win was $839.55.
So, just to recap:
- A
Tradeis made of a buy and a sell order (e.g. buy 100TSLAand sell 100TSLAsometime later) - A
Trade Groupis a container for one or moreTradesthat are conceptually related
Note: The usage of Trade Groups do not change the end outcome of the backtesting in any way; they are only used to help you understand how several Trades relate to each other and to give you a view of how the strategy performed on a trade group level.
We hope the description above is a good explanation of Trades and Trade Groups. These concepts will come up in later sections, so it is important to have a good understanding of both.
Strategy settings
Next, let's look at all the various configuration options provided by the script.
⚠️ Please note that the default settings of the strategy are in no way optimized for any stock, so you will need to learn to customize every setting provided in the script.
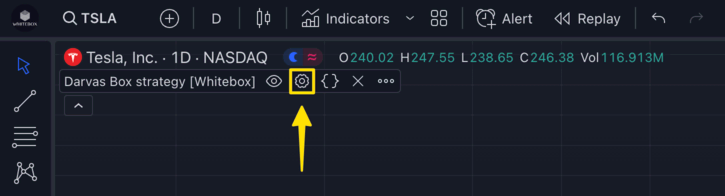
To open the strategy settings window, click on the settings icon on the script's status bar:
Darvas Box settings
In this section, you can configure everything related to how the scripts detect Darvas Boxes.
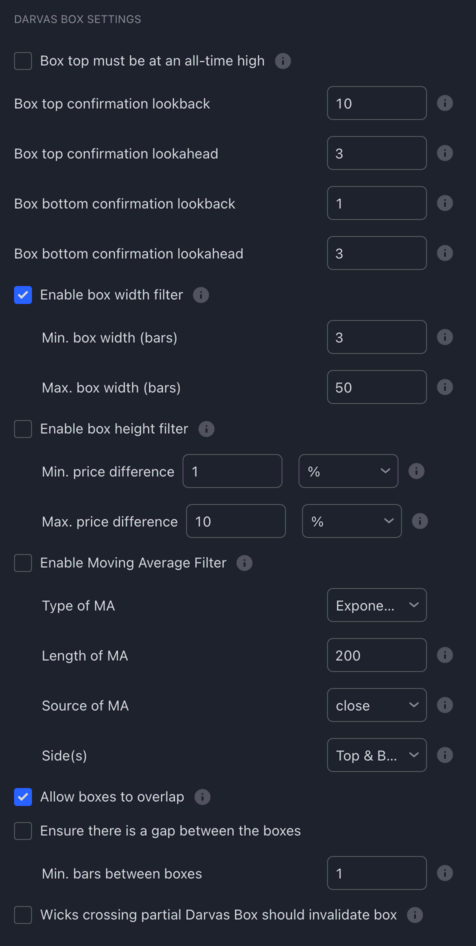
☑️ Box top must be at an all-time high: It allows you to control whether you want the strategy to consider only those Darvas Boxes valid where the box's top makes an all-time high.
Box top confirmation lookback: This setting determines how many previous candles are analyzed to confirm if a particular candle is a pivot high. A pivot high is a candle that has a higher high than the specified number of preceding candles. The "Box top confirmation lookback" setting specifies the number of these preceding candles. For instance, with a default setting of 90, the tool checks the previous 90 candles to see if the current candle's high is greater than all of them. If it is, then this candle is considered a potential pivot high, indicating the possible top of a Darvas Box.
Box top confirmation lookahead: After identifying a potential pivot high using the "Box top confirmation lookback" setting, the "Box top confirmation lookahead" setting is used to further validate this pivot high. This setting specifies the number of candles that must form after the potential pivot high, where all of these subsequent candles have highs that are lower than the potential pivot high. By default, with a setting of 3, at least three candles must form after the potential pivot high, all with highs lower than the potential pivot high. If this condition is met, the potential pivot high is confirmed as the actual pivot high, solidifying the top of the Darvas Box.
Box bottom confirmation lookback: This setting functions similarly to the "Box top confirmation lookback" but is used to determine if a particular candle is a pivot low. A pivot low is a candle that has a lower low than the specified number of preceding candles. The "Box bottom confirmation lookback" setting dictates the number of these preceding candles. With a default setting of 1, the script checks the previous candle to see if the current candle's low is lower than it. If it is, then this candle is considered a potential pivot low, indicating the possible bottom of a Darvas Box.
Box bottom confirmation lookahead: After pinpointing a potential pivot low using the "Box bottom confirmation lookback" setting, the "Box bottom confirmation lookahead" setting is employed to further validate this pivot low. This setting specifies the number of candles that must form after the potential pivot low, where all of these subsequent candles have lows that are higher than the potential pivot low. By default, with a setting of 3, at least three candles must form after the potential pivot low, all with lows higher than the potential pivot low. If this condition is satisfied, the potential pivot low is confirmed as the actual pivot low, solidifying the bottom of the Darvas Box.
☑️ Enable box width filter: This setting allows users to apply additional criteria to the Darvas Boxes based on their width, i.e., the number of bars between the top and bottom of the box. When this checkbox is enabled, only those Darvas Boxes that meet the specified width criteria will be considered valid by the strategy.
-
Min. box width (bars): This setting specifies the minimum number of bars that must be present between the candles that mark the top and the bottom of a Darvas Box. For instance, if set to 5, there must be at least 5 bars between the pivot high (top) and pivot low (bottom) for the box to be considered valid. This ensures that the box has a certain minimum duration, filtering out very short-lived boxes that may not be significant. -
Max. box width (bars): This setting determines the maximum number of bars that can form after detecting a Darvas Box. If more than the specified number of bars form without a breakout from the box, the box is deemed invalid. For example, if set to 20, and more than 20 bars form after the box is identified without a breakout, the box will no longer be considered valid. This helps in filtering out boxes that linger for too long without significant price movement, ensuring that the strategy focuses on more timely and potentially actionable boxes.
☑️ Enable box height filter: This setting allows users to apply additional criteria to the Darvas Boxes based on their height, which is the price difference between the top and bottom of the box. When this checkbox is enabled, only those Darvas Boxes that meet the specified height criteria will be considered valid by the strategy.
-
Min. price difference: This setting specifies the minimum price difference required between the top and the bottom of a Darvas Box for it to be considered valid. Users can define this difference either as a percentage of the stock price or in terms of the Average True Range (ATR). For instance, if set to 2% or 2 ATR, the difference in price between the pivot high (top) and pivot low (bottom) must be at least 2% of the stock price or 2 times the ATR value, respectively. This ensures that the box represents a significant price movement and isn't just a result of minor fluctuations. -
Max. price difference: This setting determines the maximum allowable price difference between the top and the bottom of a Darvas Box. Similar to the minimum setting, users can define this difference in terms of percentage or ATR. For example, if set to 5% or 5 ATR, the price difference between the pivot high and pivot low must not exceed 5% of the stock price or 5 times the ATR value. This helps in filtering out boxes that might be too wide, which could indicate excessive volatility or other market anomalies.
☑️ Enable Moving Average Filter: With the Moving Average Filter enabled, you can tell the strategy only to consider a Darvas Box valid if the box's top (and/or bottom) forms on the expected side of the Moving Average.
Once enabled, the MA will be plotted on the chart with a white line.
Note: This filter only applies to the first Darvas Box in a Trade Group. Once a Trade is open, subsequent Darvas Boxes are not checked against the MA Filter.
-
Type of MA: Choose the type of Moving Average you would like to use (Simple Moving Average or Exponential Moving Average) -
Length of MA: The number of historic bars to use for calculating the Moving Average. -
Source of MA: The source series to use for calculating the Moving Average. -
Side(s): Choose the side(s) of the box that have to form above (for longs) / below (for shorts) the Moving Average for the box to be considered valid.Top & Bottom: Both the top & the bottom of the box have to form on the expected side of the MA.Top: Only the top of the box has to form on the expected side of the MA.Bottom: Only the bottom of the box has to form on the expected side of the MA.
Allow boxes to overlap: This setting pertains to the occurrence of overlapping Darvas Boxes. In some instances, as stock prices move, a new Darvas Box may form that overlaps with a previously established box. By enabling this checkbox, the strategy will consider such overlapping boxes as valid and will include them in its analysis. If you prefer a more conservative approach where each box is distinctly separate from the others, you should leave this checkbox unticked. In such cases, the strategy will ensure that there is a clear gap between the end of the previous box and the start of a new one, preventing any overlaps.
☑️ Ensure there is a gap between the boxes: This setting allows users to specify whether they want a clear separation or gap between consecutive Darvas Boxes. By enabling this checkbox, the strategy will ensure that there is a minimum number of bars between the closure of one box and the formation of a new one, preventing boxes from forming immediately after one another.
Min. bars between boxes: This input defines the minimum number of bars or candles that must be present between two consecutive Darvas Boxes. For instance, if set to 20, the strategy will wait for at least 20 bars after the closure of a box before considering the formation of a new box. This ensures that there is a clear gap or pause between boxes, allowing traders to better distinguish between separate box formations and potentially reducing the impact of short-term price fluctuations. For example, if a box is identified between candle 100 and 110, and this setting is set to 20, the strategy will not consider any potential boxes until after candle 130 (110 + 20). This provides a buffer period, ensuring that the strategy is not overly reactive to immediate price movements following the closure of a box.
☑️ Wicks crossing partial Darvas Box should invalidate box: This setting pertains to how the strategy handles candles that have wicks (the thin lines extending from the top or bottom of a candle) that cross or touch a partially formed Darvas Box. A partially formed Darvas Box is one where only the top or the bottom has been confirmed, but not both. By default, the strategy is lenient and allows for wicks to cross through a partially formed box without invalidating it. The box is only considered breached or invalidated if a candle fully closes outside its boundaries. However, if you prefer a stricter approach and want the strategy to invalidate a partial Darvas Box as soon as a candle's wick touches or crosses it, you should enable this checkbox.
Volume settings
With the Entry Volume Filter enabled, you can configure the strategy to open a position only if the chosen number of recent candles' volume is above the specified Moving Average.
This filter works with both the 'Stop' and 'Market' base entry order types, though in slightly different ways.
Note: This filter only applies to the first Darvas Box in a Trade Group (i.e. the 'Base entry'). Once a Trade Group opens, subsequent Darvas Boxes are not checked against the Entry Volume Filter.
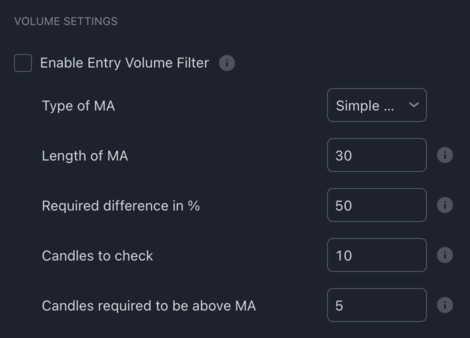
☑️ Enable Entry Volume Filter: This setting introduces a volume-based filter for trade entries. When enabled, the strategy will only open a position if the volume of recent candles meets certain criteria relative to a specified moving average of volume. This ensures that the breakout from a Darvas Box is backed by significant trading activity, potentially indicating stronger momentum.
-
Type of MA: This setting allows traders to choose the type of moving average used for volume analysis. The options are:-
EMA (Exponential Moving Average): Gives more weight to recent data, making it more responsive to recent volume changes.
-
SMA (Simple Moving Average): Calculates the average volume over a specified number of periods, giving equal weight to all data points.
-
-
Length of MA: Specifies the number of historical bars or candles used to calculate the moving average for volume. For instance, a length of 30 would calculate the moving average based on the volume of the last 30 bars. -
Required difference in %: This setting determines the minimum percentage by which a candle's volume must exceed the moving average of volume for it to be considered significant. For example, a setting of 50% means that the volume of a candle must be at least 50% higher than the moving average for it to meet the criteria. -
Candles to check: Defines the number of recent candles that the strategy will analyze to determine if the volume criteria are met. For instance, if set to 10, the strategy will look at the volume of the last 10 candles. -
Candles required to be above MA: Specifies the minimum number of candles (from the "Candles to Check" setting) that must have a volume exceeding the moving average by the "Required Difference in %" for the entry criteria to be valid. For example, if set to 5, at least 5 out of the last 10 candles (assuming "Candles to Check" is set to 10) must have a volume that's at least 50% above the moving average (assuming "Required Difference in %" is set to 50%).
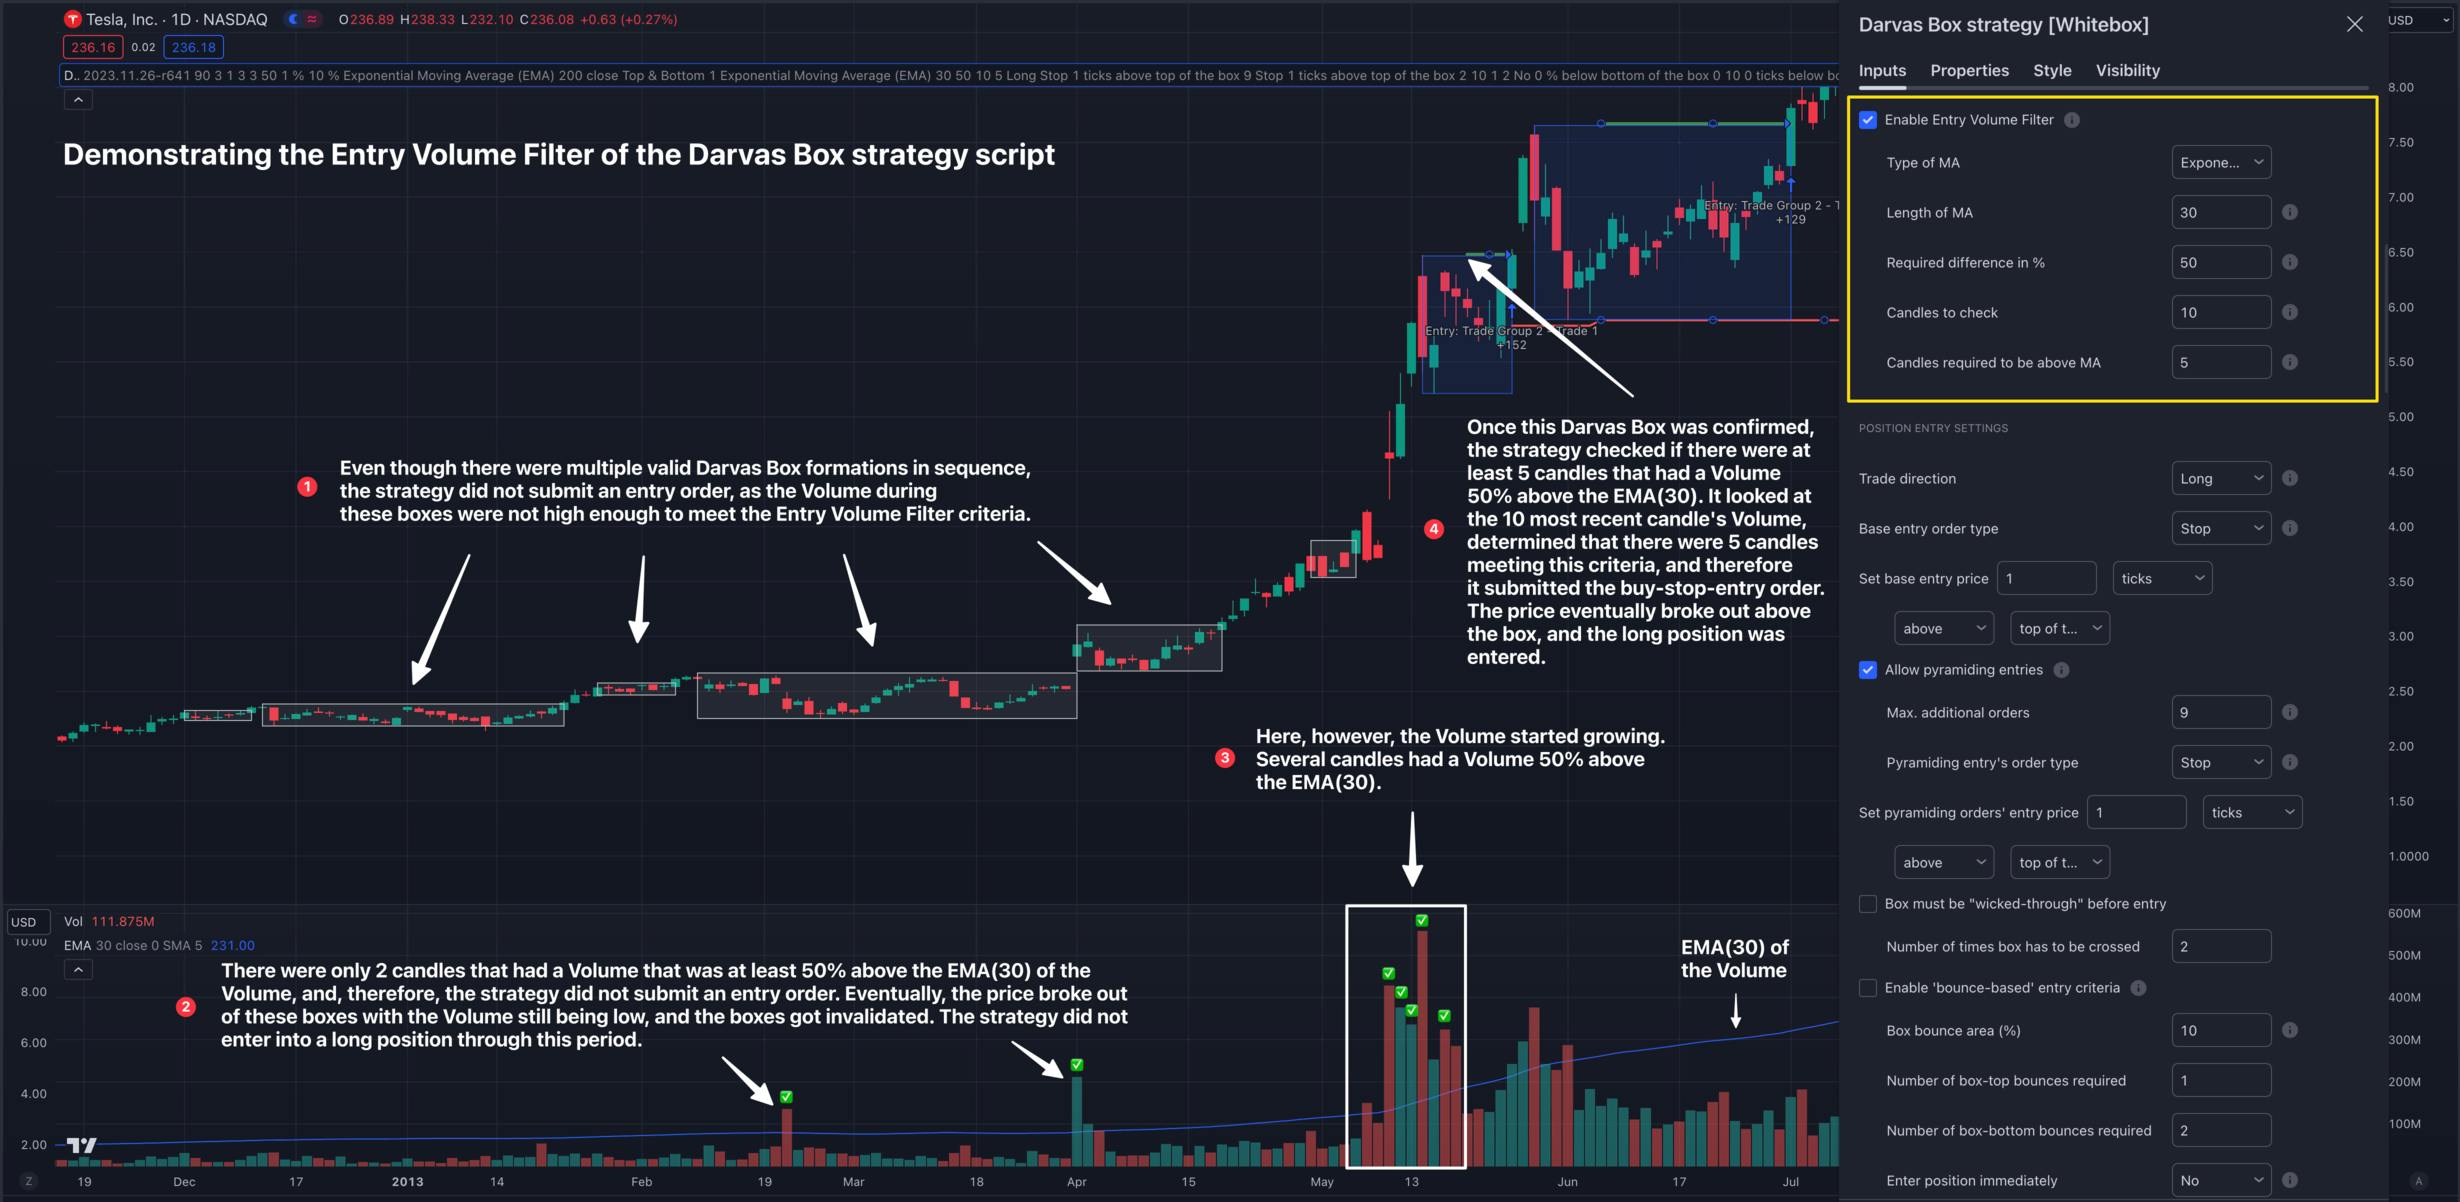
Example settings
If you have the Entry Volume Filter enabled with the following settings:
- Type of MA = EMA
- Length of MA = 30
- Required difference in % = 50
- Candles to check = 10
- Candles required to be above MA = 5
Using Market entries: When a candle closes above the Darvas Box, the strategy will check if, from the 10 most recent candles, at least 5 closed 50% above the 30 period EMA (of the volume). If this criteria is met, the position will be opened using a market entry order. If not, the Darvas Box is invalidated.
Using Stop entries: Once a Darvas Box is fully formed (i.e. both the top and the bottom are determined), the strategy will check if, from the 10 most recent candles, at least 5 closed 50% above the 30 period EMA (of the volume). If this criteria is met, the strategy submits a Stop-entry order.
If not, the strategy will check the condition on each subsequent candle close. If the volume criteria is eventually met, and the price is still within the Darvas Box, the strategy will submit the Stop entry order. If the price breaks out of the box before the volume condition is met, the Darvas Box will get invalidated.
In the example below, the strategy is placed on TSLA 1D using Stop entries:
Position Entry settings
In this section, you can configure everything related to how the strategy enters into trades.
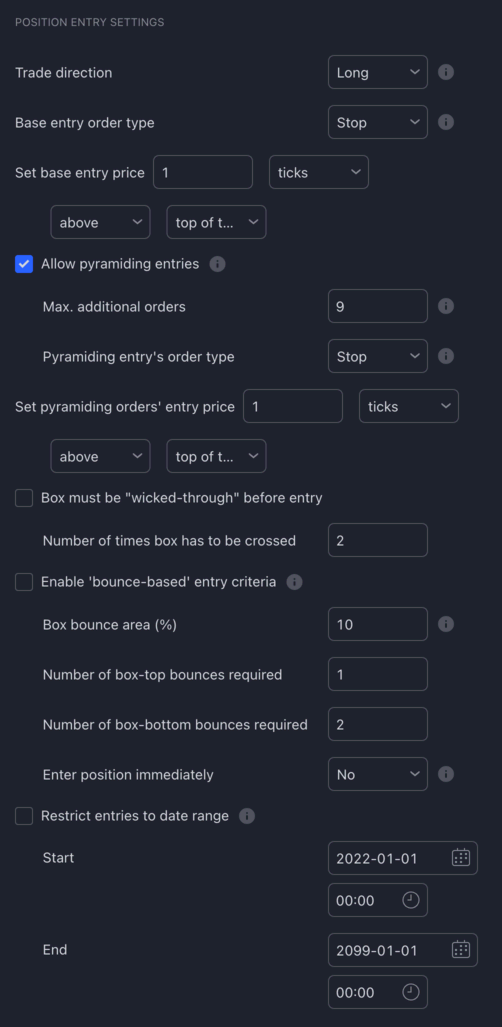
Trade direction: The direction to trade. When Long is selected, the strategy is only opening long (buy) positions. When Short is selected, the strategy is only opening short (sell) positions.
Base entry order type: The type of order the strategy should use for making its first entry in a new Trade Group (either Market or Stop.
-
Stop: The entry will be done using a 'Stop' order, placed above the current price (usually at or just above the top of the box). The stop entry order is placed as soon as a box forms. The trade may or may not be entered, depending on whether the order price is hit. -
Market: The entry will be done using a 'Market' order. The market entry order is submitted as soon as a candle closes above the box (with all the other entry criteria met). Once the market order is submitted, the position is entered at the opening of the following candle.
Set base entry price ...: The price level at which the strategy will place the buy-stop order (only used when the Base entry order type is set to Stop). The first drop-down allows you to select ticks/pips/%/ATR. In the second dropdown, you can select either above/below; in the third dropdown, you can choose either top of the box or bottom of the box.
Allow pyramiding entries: When pyramiding is enabled, as soon as a new Darvas Box forms while a trade is open, the strategy will open a new position in the same direction.
For example, assume you have order sizing set to '10% of equity', and there are no trades open yet. Once a Darvas Box forms, the strategy enters into a long position with an order size of 10% of equity. A few candles later, a new Darvas Box begins forming. As soon as the new Darvas Box is completely formed, the strategy moves up the stop loss to a level you configured in the Position Exit settings below.
Besides moving the stop loss, the strategy can also place an additional buy order when pyramiding is enabled. The additional buy order will use the same position size as the previous buy (10% of equity, though this is configurable; see the Order Size settings section below). Each and every time a new Darvas Box forms, the strategy will place an additional buy order, allowing you to scale into a trade, box by box.
-
Max. additional orders: The maximum number of pyramiding entries the strategy is allowed to place in addition to the first entry order. Once the maximum is reached, the strategy will stop placing additional orders.Please note that this only affects the additional entries, not the move of the stop loss. Every time a new Darvas Box forms, the stop loss is automatically moved to a higher level. This behaviour cannot be turned off.
-
Pyramiding entry's order type: The type of order the strategy should use for making pyramiding entries (eitherMarketorStop).-
Stop: The entry will be done using a 'Stop' order, placed above the current price (usually at or just above the top of the box). The stop entry order is placed as soon as a box forms. The trade may or may not be entered, depending on whether the order price is hit. -
Market: The entry will be done using a 'Market' order. The market entry order is submitted as soon as a candle closes above the box (with all the other entry criteria met). Once the market order is submitted, the position is entered at the opening of the following candle.
-
-
Set pyramiding orders' entry price ...: The price level at which the strategy will place the buy-stop order (only used when thePyramiding entry's order typeis set toStop). The first drop-down allows you to selectticks/pips/%/ATR. In the second dropdown, you can select eitherabove/below; in the third dropdown, you can choose eithertop of the boxorbottom of the box.
☑️ Box must be "wicked-through" before entry: This setting introduces a criteria based on the interaction of candle wicks with the top of the Darvas Box. When enabled, the strategy requires that the price, represented by the wick of a candle, pierces or "wicks through" the top of the Darvas Box without the candle actually closing above it. This behavior can be seen as the price testing the resistance of the box. By requiring multiple tests of the box's resistance before entering a position, traders can potentially filter out weaker breakout signals and focus on scenarios where the price has shown repeated interest in breaking above the box.
Number of times box has to be crossed: This input specifies the minimum number of times a candle's wick must cross or touch the top of the Darvas Box without closing above it for the entry criteria to be met. For example, if set to 2, the strategy will only consider entering a position if it has recorded at least two instances of candles wicking through the top of the box. This repeated testing of the box's resistance can be seen as an indication of persistent buying interest, potentially signalling a more robust breakout when it eventually occurs.
☑️ Enable 'bounce-based' entry criteria: The bounce-based entry criteria is a unique feature that allows traders to identify and capitalize on price movements within the Darvas Box. When enabled, the strategy will monitor for candles that "bounce" or reverse direction within specific areas of the box, indicating potential buying or selling pressure. This criteria can be particularly useful for traders who want to capture intra-box price movements before a potential breakout or breakdown.
-
Box bounce area (%): This input defines the percentage of the Darvas Box that will be designated as the "bounce area" at both the top and bottom of the box. For instance, if set to 10%, the strategy will consider the top 10% and bottom 10% of the box as areas where bounces can occur. These areas are visually represented by green dashed lines inside the box, helping traders easily identify potential bounce zones. -
Number of box-top bounces required: This input specifies the minimum number of times a candle must bounce off the top "bounce area" of the Darvas Box for the entry criteria to be met. A bounce is detected when a candle wicks into the bounce area and forms a pivot high, indicating potential selling pressure. -
Number of box-bottom bounces required: Similarly, this input determines the minimum number of times a candle must bounce off the bottom "bounce area" of the Darvas Box. A bounce at the bottom is identified when a candle wicks into the bounce area and forms a pivot low, signalling potential buying interest. -
Enter position immediately: When this option is enabled, the strategy will automatically enter a position as soon as the specified number of bounces (either at the top or bottom) are detected. This allows traders to act swiftly on intra-box price movements without waiting for additional confirmation.
Restrict entries to date range: This setting allows traders to specify a particular date range within which the strategy should consider entering positions. By defining a start and end date, traders can focus the strategy's analysis on specific periods of interest, such as during particular market events or conditions.
-
Start and End Date selectors: These date selectors let traders define the exact date range for the strategy's operation. The strategy will only consider potential entries that fall within the specified date range. -
Important Considerations:
Data Availability: The strategy's ability to backtest is contingent on the amount of historical data that TradingView provides. The number of historical bars or data points you can access depends on your TradingView subscription level.
Subscription Limitations: For instance, with a free TradingView subscription, you're limited to 5,000 historical bars. This translates to 5,000 hours of data on an hourly chart (approximately 208 days) or 5,000 minutes on a 1-minute chart (around 3.5 days).
Date Range Restrictions: Setting a start date that predates the available historical data won't extend the data range. Ensure that the start date you choose is within the range of available data. If the start date is set before the first available historical bar, the restriction will be ineffective, and the strategy will operate based on the data it has access to.
Position Exit settings
In this section, you can configure everything related to how the strategy exits from trades.
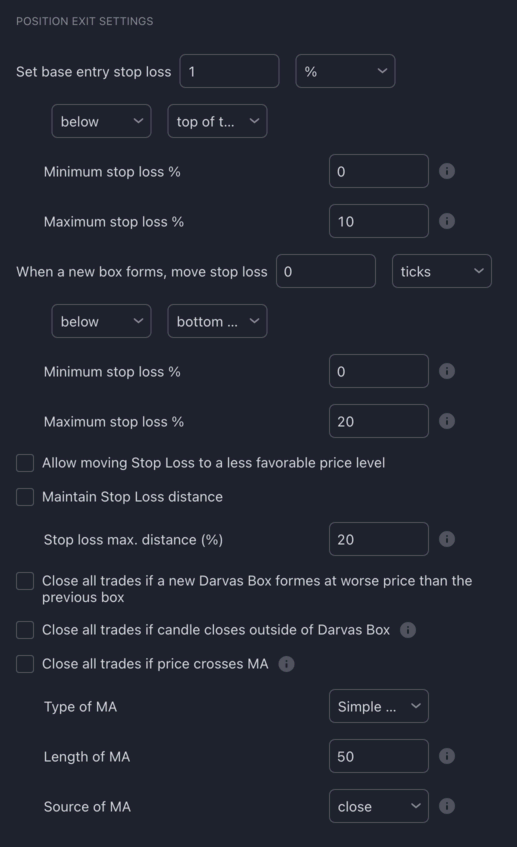
Set base entry stop loss ...: The price level at which the strategy will place the initial stop loss order following the first (base) entry. The first drop-down allows you to select ticks/pips/%/ATR. In the second dropdown, you can select either above/below; in the third dropdown, you can choose either top of the box/bottom of the box/entry price.
-
Minimum stop loss %: You can use this as a safety net to prevent the stop loss being placed too close to the entry price. Setting this to 2 for example would result in the strategy never placing the stop loss closer than 2% to the entry price. -
Maximum stop loss %: You can use this as a safety net to prevent the stop loss being placed too far away from the entry price. Setting this to 10 for example would result in the strategy never placing the stop loss further than 10% away from the entry price.
When a new box forms, move stop loss ...: Stop loss configuration for additional (i.e. pyramiding) entries. The first drop-down allows you to select ticks/pips/%/ATR. In the second dropdown, you can select either above/below; in the third dropdown, you can choose either top of the box/bottom of the box/top of the previous box/bottom of the previous box. When a new Darvas Box forms, the stop loss will be moved to the configured price level.
-
Minimum stop loss %: You can use this as a safety net to prevent the stop loss from being placed too close to the base price. Setting this to 2, for example, would result in the strategy never placing the stop loss closer than 2% to the base price. -
Maximum stop loss %: You can use this as a safety net to prevent the stop loss from being placed too far away from the base price. Setting this to 10, for example, would result in the strategy never placing the stop loss further than 10% away from the base price.
Allow moving Stop Loss to a less favorable price level: If enabled, the strategy will allow the stop loss to be moved to a price level which is less favorable than the current one.
Maintain Stop Loss distance: If enabled, the strategy will not allow the price to get too far away from the stop loss. This can be useful when, for example, the price suddenly starts rallying to higher highs, and it fails to form a new Darvas Box. In this case, if the price were to drop suddenly, you would miss out on the price increase.
Stop loss max. distance (%): The maximum difference in % between the current price and the stop loss. If the price ever gets further than this %, the stop loss is adjusted automatically to be, at most, this % away from the price.
Close all trades if a new Darvas Box forms at worse price than the previous box: As the title implies, if while in a trade a new Darvas Box forms at a worse price than the previous box, all open trades will be closed.
Close all trades if candle closes outside of Darvas Box: Assume the strategy is in a long trade. When the position was entered, the stop loss was placed 3 ATRs below the entry price, well under the Darvas Box.
The price reverses a few candles into the trade and takes a dive. The most recent candle just closed under the most recent Darvas Box.
Would you want the strategy to carry on with the trade and wait until the stop loss is eventually hit? Or would you rather want it to close the trade immediately after the candle closed under the box?
If you want the strategy to close the trade, tick this checkbox.
Close all trades if price crosses MA: If enabled, the strategy will close an open position as soon as the price crosses the specified Moving Average.
Long positions will be closed if the price crosses below the MA. Short positions will be closed if the price crosses above the MA.
The condition is only evaluated at bar close.
Once enabled, the specified MA will be plotted on the chart with a purple line.
Order Size settings
The inputs in this section allow you to override the built-in position sizing mechanism.
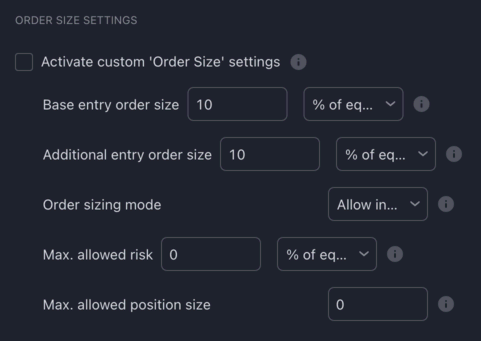
Activate custom 'Order Size' settings: The general way of configuring the size of each order is done via the "Order Size" input in the "Properties" tab of the strategy settings panel. This "Properties" tab is provided by TradingView automatically for all strategies, and the settings therein are what the strategy uses by default to size each order it makes. Unfortunately TradingView does not provide a way for you to configure how much of your equity you are willing to risk per trade. (The equity is the sum of the initial capital, net profit, and unrealised profit/loss). We can work around this "limitation" by creating our own setting for this and ignoring whatever the "Order Size" is set to in the "Properties" tab. By enabling this checkbox, you tell the strategy to ignore whatever is set in the 'Order Size' input in the "Properties" tab and instead use the "Order Size" settings below.
-
Base entry order size: The size of the order the strategy will use for each entry it makes.Contracts: Number of contracts/shares/lots/units to trade (e.g. setting this to 1 will result in the strategy of buying/selling 1 BTC per order)Cash: The amount of cash to use from your equity per order (e.g. setting this to 1000 will result in the strategy of buying/selling $1000 worth of BTC per trade)% of equity: The percentage of the strategy's equity to use per order (e.g. with an account size of $1000 and this set to 10, will result in the strategy buying/selling $100 worth of BTC per trade)% risk of equity: The percentage of your account size you want to risk per trade.
For example, with an account size of $100,000, if you enter a trade at $1000 per unit with a take profit target set to $1200 and a stop loss target set to $900 (Risk/Reward 1:2), using 1.0% risk, will result in an order size of 10 units for a total value of $10,000. Why? Because 1.0% of your account size is $1000 (this is the money you are comfortable with risking per trade), and by buying 1 unit at $1000 with a stop loss set to $900, you are essentially risking $100 per each unit bought. $100 is 10 times less than the money you are willing to risk per trade ($1000), therefore you can buy 10 units to arrive at your risk of $1000 per trade (which is 1% of your account size).Fixed risk: The maximum amount of cash to risk on each trade (to learn more about how the position size is calculated, please see above)
All of these options are currency-aware. For example, if you set the order size to 1000 and the sizing type to
Cash, if your account's currency is set toGBP, then the strategy will open positions in the value of £1000 (e.g. $1300) per order. -
Additional entry order size: The size of the order the strategy will use for each pyramiding entry it makes. -
Order Sizing Mode: Imagine the following situation- You are looking at the
BTC/USDchart on a 1 hour time frame, with 1 Bitcoin trading for $50,000 - Your initial capital is $10,000
- You set
% risk of equityto 1% (i.e. $100 of your account), or you set aFixed riskof $100 - The strategy signals a long entry at $50,000 with a stop loss set to $49,950 and the take profit set to $50,100 (Risk/Reward 1:2)
- In order to open a position risking $100 of your account, you need to buy 2 Bitcoins. (If you were to buy 1 Bitcoin, the risk would be only $50, half of what your desired risk is)
In order to buy 2 Bitcoins, you need $100,000, but you only have $10,000 on your account. How do you want the strategy to proceed?
You have the following options:
Allow infinitely large position size: The strategy will assume that you have access to more money than what you have on your account (i.e. via leverage), and it will open a position for 2 Bitcoins. Risk will be $100 (1% of your account size).Limit position value to account size: The strategy will assume that you don't have access to leverage, and it will open the biggest position you can afford ($10,000 / $50,000 = 0.2 BTC). Risk will be $10 (0.1% of your account size).Skip entry if can't afford desired position size: The strategy will assume that you don't want to enter into a position, if in order to meet your risk settings you would have to take on a position bigger than your account size.
- You are looking at the
-
Max. allowed risk: The maximum% of equityorCashthe strategy should risk on any given trade. When set to 0, this config is ignored.Think of this as a safety net. If you use an order sizing mechanism that doesn't control the risk (such as
% of equity), you are going to risk a random amount on each trade. However, if you configure aMax. Allowed Riskof100Cashfor example, your position size will always be capped, so that you only risk at most $100 on each trade. -
Max. allowed position size: The maximum size of the position the strategy is allowed to take on any given order. When set to 0, this config is ignored.
Price settings
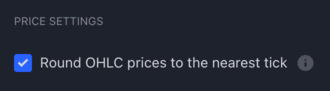
☑️ Round OHLC prices to the nearest tick: By default, the strategy will round each candle's Open, High, Low and Close prices to the nearest tick of the instrument and will work with these rounded values in its calculations. (The tick size is the instrument's smallest price increment). Why is this necessary? Why doesn't it just use the 'raw' OHLC values provided by TradingView?
While the chart displays prices rounded to the instrument's tick size, the built-in OHLC values in scripts may sometimes capture prices with more precision than shown on the chart.
This occurs due to data feeds containing prices that exceed the symbol's tick precision. For instance, while a feed might have a close price of 182.08, the chart could display it as 182.1, reflecting the tick size of 0.1.
Such subtle differences can impact precision-critical calculations in a script, like detecting crossovers. To ensure consistency and avoid potential discrepancies, it's advisable to round OHLC values to the instrument's tick size in script calculations.
While not recommended, if you would like to turn off this behaviour for whatever reason, untick this checkbox.
Alert settings
The Alerts work exactly the same way as in our other strategies.
Please check out the Alerts page for more information.
The only change we made here is the addition of a new Darvas Box Formed alert message box, and two new alert message placeholders: {{box.top}} / {{box.bottom}}
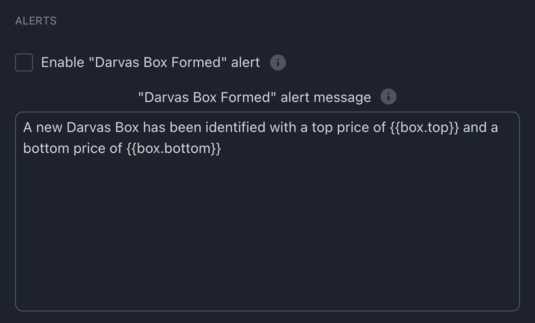
"Darvas Box Formed" alert message: If enabled, an alert will be sent the moment the strategy identifies a confirmed Darvas Box.
Appearance settings
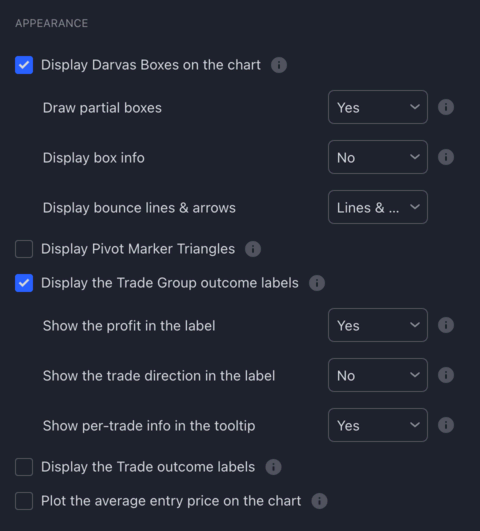
☑️ Display Darvas Boxes on the chart: If enabled, the strategy will display the Darvas Boxes on the chart.
-
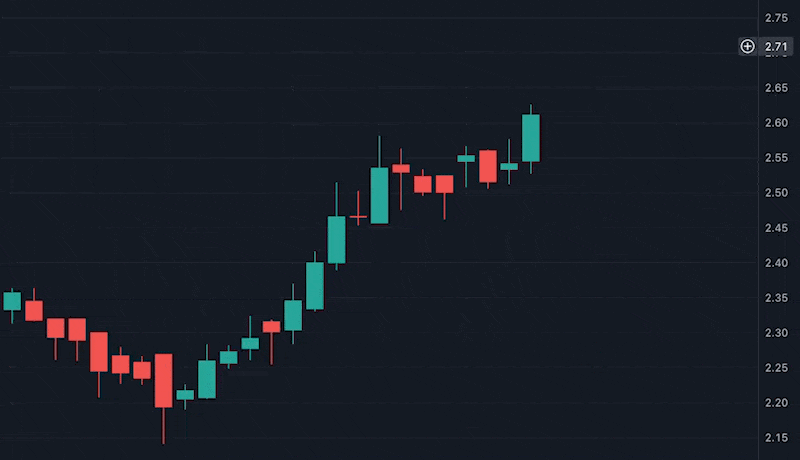
Draw partial boxes: If enabled, the strategy will draw a Darvas Box as soon as either side of it starts forming.As you can see in the GIF below, as soon as the top of the box was confirmed, the strategy started to draw a blue horizontal line marking the top. Then, a few candles later, when the bottom was also confirmed, the box was fully drawn, indicating that both the top and the bottom had been confirmed. The green line appearing above the box is the buy-stop order pending entry.
-
Display box info: If enabled, an info label (ℹ️) with a tooltip will be displayed underneath each Darvas Box. Hover this label to find out more information about the box.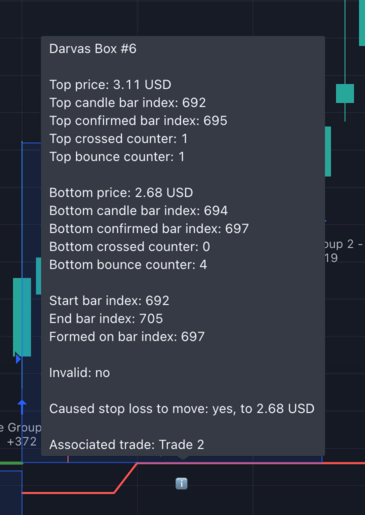
-
Display bounce lines & arrows: If you enable theBounce-based entry criteria, the strategy will draw a green dashed line below the top and above the bottom of the box, marking the areas where the price needs to bounce off from in order for the strategy to consider the price movement as a "bounce off the edge of the box" event. Besides these lines, the strategy will display a red arrow above the box whenever the price bounces off from the top and a green arrow below the box whenever the price bounces off from the bottom.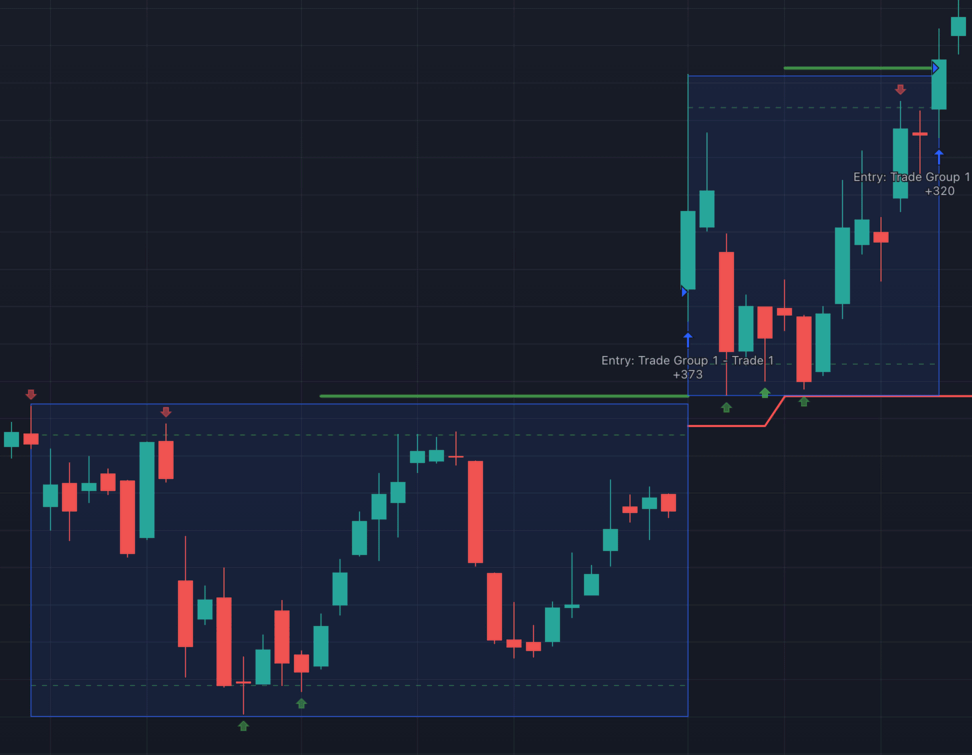
☑️ Display Pivot Marker Triangles: This setting allows the script to visually indicate pivot points on the chart, which are crucial for detecting Darvas boxes.
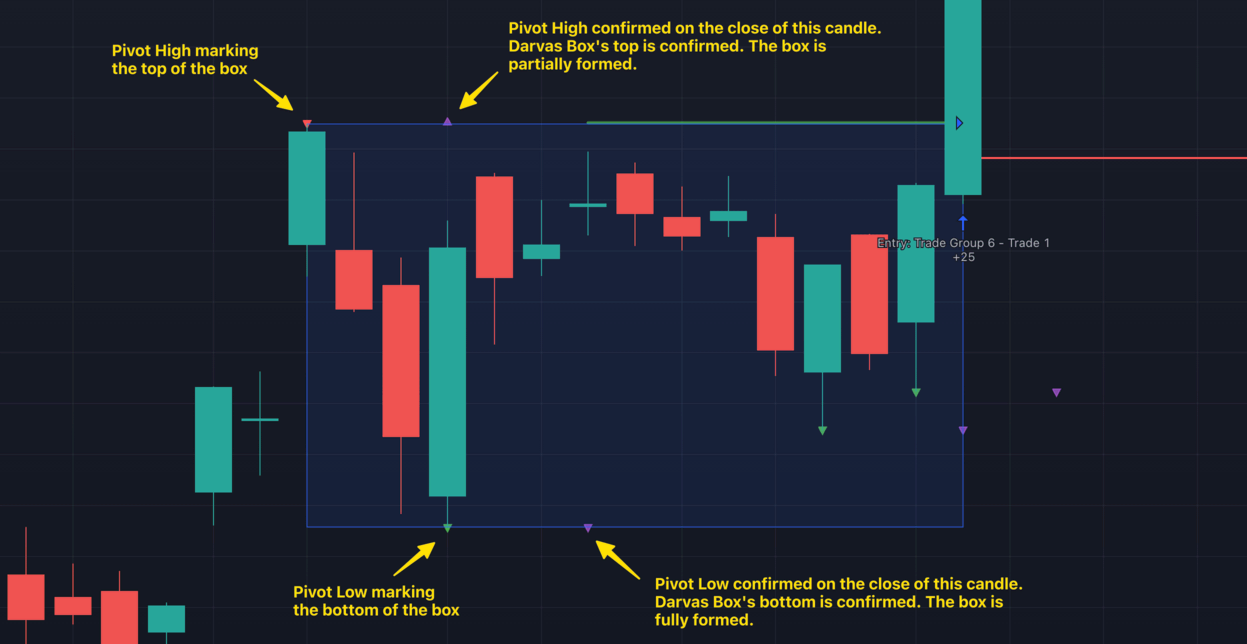
How it works
Pivot Points: In the context of the Darvas Box strategy, a pivot point represents a significant price level where the stock's direction changes. These pivot points help in identifying the top and bottom boundaries of a Darvas Box.
Triangle markers
Red triangle: Placed above a candle indicates a confirmed pivot high. This means both the lookback and lookahead candles have been verified.
Green triangle: Positioned below a candle signifies a confirmed pivot low. This also means both the lookback and lookahead candles have been verified.
Purple triangle: This marks the candle where the pivot point was confirmed.
Pivot confirmation explained
Pivot confirmation is a process that ensures the identified pivot point is valid. It's a lagging process, meaning the confirmation comes after a set number of candles.
For instance, if you've set the 'Box top confirmation' to 3 and notice a potential pivot high on the 98th candle, the script will only confirm this pivot high after 3 more candles (on the 101st candle). If the 98th candle remains the pivot high even after the 101st candle is drawn, the script will then mark the 98th candle with a red triangle, indicating it's the confirmed pivot high. The purple triangle on the 101st candle will show when this confirmation occurred.
Why pivots matter for Darvas Boxes
Pivot points are essential for the Darvas Box strategy because they help determine the box's boundaries. A Darvas Box encapsulates a stock's trading range, and these pivot points, representing significant highs and lows, define the box's top and bottom edges. By identifying and confirming these pivot points, the strategy can more accurately determine potential breakout or breakdown points, guiding trading decisions.
☑️ Display the Trade Group outcome labels: If enabled, the strategy will display the green and red "Win" / "Loss" labels underneath each closed Trade Group.
If the sum of the profits of all trades within a trade group is positive, the label is shown with a green background. If the sum of all profits is negative, a red label is used.
You can choose to show/hide the amount of profit/loss shown in the label (Show the profit in the label), and also to show hide the direction of the trade (Long/Short).
If you hover your mouse over the label, a tooltip with statistics about the Trade Group will be shown.
And, if you enable Show per-trade info in the tooltip, the strategy will also display per-trade statistics above the trade group statistics.
☑️ Display the Trade outcome labels: If enabled, the strategy will display a Win/Loss 'Trade outcome' label for each trade in a Trade Group. Hover the label to find out more information about the trade.
☑️ Plot the average entry price on the chart: If enabled, the Trade Group's average entry price will be plotted using an aqua (green/blue) line. The avg. entry price is calculated via the sum of all entries (entry price * position size) / total position size.
Recommended readings
Newspaper archive
1959
Nightclub Dancer Makes Fortune In Wall Street (International Gazette, Black Rock, New York · Wednesday, June 03, 1959)

1960
$2,000,000... "just that second income" (12 Jun 1960, Sun Chicago Tribune)

Dancer Catches That Wall Street Rhythm (Daily News · 18 Dec 1960, Sun)
Page 1/2:

Page 2/2:

1961
Did He Really Make A Mint? (The Miami News · 28 Jan 1961, Sat)

1962
End Battle Over Book By Darvas (Daily News New York, New York · Wednesday, April 18, 1962)

Musical Planned On Darvas Book (The Berkshire Eagle, Pittsfield, Massachusetts · Tuesday, May 15, 1962)

1964
Land Of Samba (The Miami News, Miami, Florida · Tuesday, January 28, 1964)
